
What is Reddit's opinion of
NetCrunch?
From 3.5 billion Reddit comments
100 reviews of this app found across Reddit:
Try our NetCrunch network monitoring suite. We have built-in physical segments layer-2 maps (that show live traffic), and a powerful framework for dynamic mapping with live widgets in the style of Visio.
That's only a small part of the package however, ideally you'd be able to handle all of your monitoring and management from notification to remediation from the console.
Not everyone is going to receive phone or email alerts. Not every alert deserves to be sent via phone or email. A dashboard is going to give you an overview of the health of your network at any given time. A dashboard can show you all of your current ongoing problems. A dashboard can show you a history of what has gone wrong and when. Check out NetCrunch and see what a modern GUI can do for you.
If you do a search, you'll find a ton of these monitoring threads recently. That being said, NetCrunch 8 is a great option for a comprehensive, all-in-one monitoring and management solution. Servers, among many other devices, are identified and monitored out of the box. Reports are easy to generate, can be sent automatically, and are clear and easy to read.
NetCrunch 8 has NetFlow views built-in with top talkers, which you can show globally, or by subnets/sites/ranges/etc
NetCrunch 8 should be added to your list of tested products. It's all-in-one, including built in NetFlow and will identify and begin monitoring your devices out of the box. The SNMP capabilities are very advanced, with SNMPv3 support and a built-in MIB compiler on top of the 3500+ included MIBs. Logs are stored and can be monitored by change or searching content, and applying alerts or responses based on them. Among the included "monitoring packs" for apps are predefined Exchange and SQL ones.
As for the dashboard, it's probably the single best differentiating feature of NetCrunch. There's many NMS products out there, and feature-wise there's not much differentiation. NetCrunch has clear dashboards that are easy-to-understand and easy-to-use. If you're using it in a multi-screen NOC setting, different views can be split out as well.
The NetCrunch network monitoring system runs on Windows Server, and has pre-configured monitoring packs for Windows that'll have you up and running in minutes. It only requires 4GB RAM and 4 Cores, which can be on a VM. It may be overkill, but give it a try! I work for AdRem so if you have any questions i can help.
NetCrunch has website monitoring built into its monitoring suite. You can create custom users with limited dashboards and lock the ability to make changes for clients to be able to log in and see their status. Reports can be generated and sent out automatically as well. I work for AdRem so if you do have any question i can help!
Fire up the 30-day trial of NetCrunch. It'll identify the various components in your network, provide you with an inventory, map your network for you, and the predefined monitoring packs will show you where there are any potential issues right off the bat.
As this network is newly built, and has no documentation, you have the chance to write the documentation and make the network your own.
Getting an error when trying to log in through Google, but you could consider adding NetCrunch Tools. It's a freeware toolkit that features Ping, Traceroute, Wake OnLAN, DNS Info, Who Is, Ping Scanner, Service Scanner, Open TCP Port Scanner, SNMP Scanner, DNS Audit and Mac Resolver in one GUI.
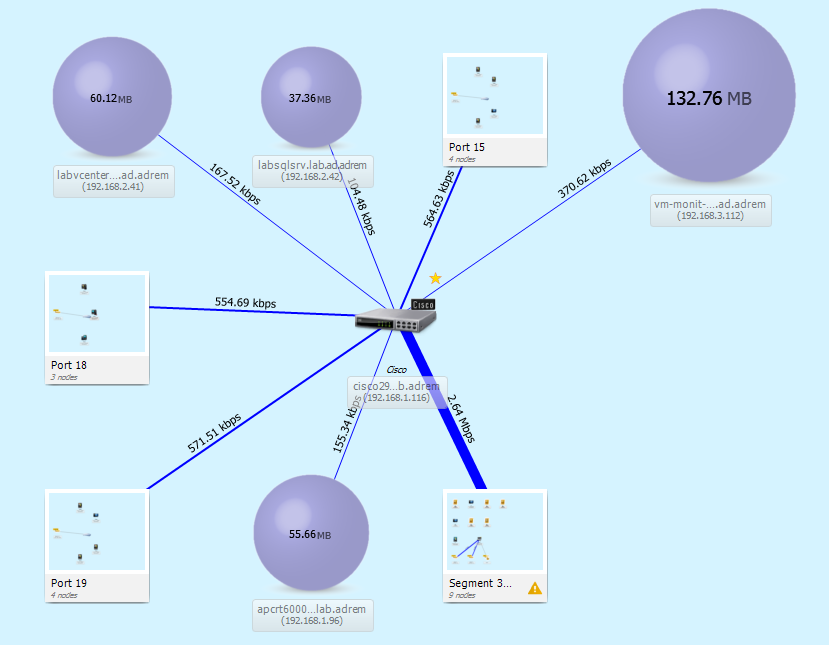
NetCrunch 8 will do all of that for you, and automatically to boot. The layer 2 map is especially good, showing you the physical connections between devices, and the connections grow thicker the more throughput going through, helping you drill down and find bandwidth hogs. Traffic is also covered through NetFlow, both at the device level, and network wide.
Are you going at it solo? If you have an NMS solution in place, see about having it automate as much as possible for you, like rebooting machines on conditions, restarting services, etc. If not, see about investing in one like NetCrunch 8. The FOSS options are great if you're on a limited budget, but will be time consuming. Automating as much of the day-to-day monitoring/management will free you up for the scheduled maintenance tasks you'll be undertaking, and getting regular reports will show you where potential problems are forming. Being able to build maps of your network, including physical segments maps, will also save you time in locating devices/ports/etc. A clear overview of all your devices and what they're running will also help you wrap your head around what kind of maintenance you'll need to be doing.
You can get better than a "rough" idea with NetCrunch 8. It's got a 30-day free trial license if you just need a temporary solution, and among the normal monitoring/management features, it's got a physical segment mapper that will show you what is connected to what, and on what port(s). Most of your devices will be identified out of the box as well, specifically systems and networking devices. The only thing it won't do for you here is your configs.
Our NetCrunch network monitoring suite supports notifications via GSM modem, and we've recently added two-way integration with popular services and messaging services. We currently support freshdesk, HipChat, IFTTT, pagerduty, slack, trello, twitter and zendesk, and OpsGenie is actually coming in the next build release.
Check out our NetCrunch network monitoring suite. Unlike other options, we license only by number of monitored nodes (so your stacked switches can count as one node) with no limit on the number of sensors/elements/ports/etc monitored on each one. The new 64-bit server that we just implemented can support monitoring over 650,000 sensors on a single installation (which can be VM)
Give our NetCrunch network monitoring suite a try. It'll have the scope and scalability of Solarwinds, at the PRTG pricepoint. It's got comprehensive SNMP support, including SNMPv3 and a built-in MIB compiler. It can not only monitor your logs, but act as a log server (the database is embedded and is not limited in size or length of time you keep your data), and since becoming Cisco partners we have comprehensive NetFlow support (including NBAR and IP SLA). I can even help you out here, if you don't want to use the official channels.
Our NetCrunch network monitoring suite might fit the bill. It's all-in-one network, server, application, file, log and web monitoring. Self-remediation is available so you can run scripts, restart services and reboot machines automatically. The notification system is highly customizable, and we've recently added alert escalation as well (say if after 20 minutes of informing Jr. SysAdmin the alert is still up, alert Sr. SysAdmin). One of our MSP users did a little Q&A a little while ago in /r/MSP
Give NetCrunch a try. It runs on Windows Server, and we're a Microsoft partner. It's an agentless, all-in-one network, server, application, file, log and web monitoring in one.
NetCrunch has automatic mapping built into its network monitoring suite that covers everything you listed, including layer-2 physical segments mapping and dependencies. If you have any questions, i can help i work for AdRem.
Check out NetCrunch. It's an all-in-one network monitoring suite. You'll be able to see traffic bottlenecks on the physical segments map, showing you traffic between points and letting you drill to endpoints. It supports traffic monitoring/reporting through SNMP, NetFlow, sFlow/jFlow, as well as Cisco NBAR.
There's over 100 built-in monitoring packs for popular hardware and software solutions, with preconfigured thresholds, reports, and alerts so you'll be able to see performance concerns out-of-the-box.
If you do need additional help, the trial comes with free tech support, and we also offer free live installation assistance via webinar.
The NetCrunch Tools toolkit is also a freeware tool worth checking out. It's got ping, traceroute, Wake OnLAN, DNS Info, Who Is, ping, service, SNMP and open TCP port scanners, DNS audit and a MAC resolver in one.
NetCrunch 8 isn't free, but it's low cost and licensed by node. It's also got an embedded SQL database, saving you cost there. Otherwise, Nagios is the way to go if you've got the time and skill to set it up.
NetCrunch 8 has alert correlation, so if some condition is met it'll be flagged as important (say CPU > whatever), but when it goes back below the threshold then the alert is closed. It's still in the log if you want to go back and look, or chart it, but otherwise it's closed and not requiring your attention. This is especially useful with the baseline thresholds that can be built over time.
Again? Tons of threads if you do a search, some better than others. I suggest NetCrunch 8 but without any specifics, it's hard to suggest anything over anything else. Most of the options out there are going to cover the same things, with differences in GUI and price point.
If you're demoing PRTG you should check out NetCrunch as well. Similar price point with much more scalability and flexibility. We've got a powerful automation framework for running scripts, restarting services, rebooting machines, etc and we've recently added text parsing expressions for number 2 ;)
You could try our NetCrunch network monitoring suite. SNMP of course is at the core, with full support including SNMPv3 and a built-in MIB compiler. Windows is monitored without SNMP by default, using the onboard counters like WMI. We have precompiled monitoring packs for hundreds of popular devices and apps (including MS SQL).
There's also a full-featured file/log monitor. The database for NC9 is embedded, and isn't limited in size or length of time your data is kept, so you can use it as a log server as well.
If you do want everything in one system, then it's definitely worth a look. Our site doesn't have pricing info, but the guys at 4sysops added pricing for their recent review.
If you do have any questions, let me know! If you download the trial, you're entitled to not only 30 days of tech support, but live installation assistance as well.
If you're looking for a full-featured NMS, try the NetCrunch network monitoring suite. It's an all-in-one network, server, application, file, log and web monitoring suite. I work for AdRem, so let me know if i can help with anything.
Give our NetCrunch network monitoring suite a try. It's all-in-one network, server, application, file, log and web monitoring. It comes with 30 days of free support and free live installation assistance. If you got any questions or want a quote outside of the regular channels, lemme know.
You could give our NetCrunch network monitoring suite a try. We're a Microsoft partner (as well as Cisco and VMWare) and will have your servers and workstations monitored out of the box in minutes. On top of that, we offer free live installation assistance to help you get a POC set up.
Try the NetCrunch network monitoring suite. It's all-in-one network, server, application, file, log and web monitoring. We're a Microsoft, VMWare, and Cisco partner with full support for their devices, so you'll be good to go out-of-the-box in minutes.
Check out our NetCrunch network monitoring suite. If you need help writing anything up, i can help i work for AdRem. The suite has a built-in demo Atlas, so you can see how it works, make changes to monitoring, and respond to alerts without having to have the equipment yourself.
Give NetCrunch 8 a try. It runs on Windows (which can be a VM without performance degradation), is agentless, and has an embedded database. We offer free installation assistance and 30 days of tech support.
Check us out at AdRem Software! We have two freeware tools: NetCrunch Tools and MyNet Toolset (with another coming shortly). We also have our flagship NetCrunch network monitoring system. It's an all-in-one and agentless network, server, application, file, log and web monitoring suite.
Spiceworks may be your best bet, as it's free, and should be able to handle the workload. It's not particularly scalable, but at the size of your network it should be fine. It looks like you're gonna end up with ~160 nodes, which isn't that small. If you'd like to try a commercial solution that runs on Windows, i'd recommend NetCrunch 8. It's all-in-one and agentless. I work for them, and they do offer not-for-profit discounts, as well as discounts for taking part in a success story
Check out NetCrunch 8. It's agentless, all-in-one, and has an embedded database with no size or time limits. I work for AdRem so if you have any questions you can ask here or at /r/netcrunch.
There's been a surge in these questions recently. Either way, i'd recommend giving NetCrunch 8 a shot.
It's an all-in-one network, server, application, file and web monitoring suite. It's agentless, and has an embedded database that isn't limited in size or length of time data is kept.
It's highly scalable, and a single server installation has currently been lab tested up to 240,000 sensors. It only needs 4GB of RAM and 4 cores, and that can be on a VM.
As it's been brought up recently, i do work for AdRem. So if you do have any questions, feel free to ask here or to use the /r/netcrunch subreddit
NetCrunch 8 is a great all-in-one option, with a new GUI and highly scalable. A single server installation has no set limit but can run up to around 7,000 nodes or 240,000 sensors (PRTG has a recommended maximum limit of 10,000). It's got an embedded database that doesn't limit the size or length of time your data is kept.
It's not so much a "monitoring sucks" rant, as a "configuring Nagios sucks" rant and a plug. You can always get a paid solution like NetCrunch (my plug), that puts everything into one easy, automated package to eliminate the "suck" of open-source monitoring. All cloud free.
Give our NetCrunch network monitoring suite a try:
- You can set up fault tolerance on a VMWare cluster. We don't have any performance degradation on VMs, and can support over 650,000 sensors from a single one (as opposed to 2,500 for PRTG).
- Alerting of course via SMS/Email, but also comprehensive conditional alerting and automatic corrective actions like restarting services, rebooting machines, running scripts, etc. Monitoring dependencies is built in, and if a core switch goes down, you'll get that critical alert but it will silence everything below.
- SNMP is our bread and butter. Full support up to and including SNMPv3. Thousands of MIBs included, and a built-in MIB compiler.
- Of course
- Can collect and read syslogs, text parsing expressions. The database is embedded, and there's no limit on size or length of time you keep your data (and no additional costs).
Set up is a breeze, we support hundreds of popular devices and apps out of the box. On top of that, we offer free installation assistance, so you can sit down with an engineer via webinar and get a proof of concept set up.
Price point is at the PRTG level, but we monitor by node only, and don't limit sensors/elements/counters/whatever. I can of course give you info here if you want to avoid the official channels.
Check out our NetCrunch network monitoring suite. We've had a few pretty cool recent use cases from clients:
When disk space was below 10%, the client would automatically run a script deleting temp files. If disk space was still below 10%, he'd be notified. If not, carry on.
A radio station in Washington would live-update its website with the current playing song to make a recently-played list. NetCrunch was set up to notify them if the page hadn't been update in x-minutes.
We offer a powerful framework for letting you accomplish, and monitor, anything out there. Check us out today, we offer 30 days of free tech support, as well as free installation assistance via live webinar if you want help getting a proof of concept set up.
Our NetCrunch network monitoring suite is worth a try. It's an all-in-one and agentless network, server, application, file, log and web monitoring suite. If you download the trial, we'll even help you set it up for free via live webinar and get a proof of concept going. We're Microsoft, VMWare and Cisco partners, and support hundreds of devices and apps out of the box. Setup takes minutes.
Pricing isn't available on the main site, but it's available at 4sysops and other review sites. I can also help with any questions if you want to avoid the official routes.
We've got two freeware tools you might find useful:
NetCrunch Tools: A toolkit that combines 11 useful features
WMI Tools: Lets you access WMI information locally, remotely, and run custom WMI queries.
Our NetCrunch network monitoring suite is agentless, and offers all-in-one network, server, application, file, log and web monitoring. It supports hundreds of popular apps and devices out of the box, and sets up in minutes. There is no cloud-based agentless option out there, but at best hybrid ones where you still have a collector installed that pushes data out. With NetCrunch you can access your data via desktop, mobile and web clients. If you want to give it a go, we offer 30 days of tech support as well as free live installation and setup assistance. ITSM Daily and 4sysops have recent reviews with pricing.
You could try our NetCrunch network monitoring suite. Log/file monitoring is built-in, and our proprietary embedded database can also act as a log server, and isn't limited in size or length of time you keep your data.
Try NetCrunch. It's an all-in-one network, server, application, file, log and web monitoring suite. We're also a VMWare partner so there's full support, and we can help you get it installed as a POC for free. The 300-node license (no limit on the number of "sensors" or "elements" or anything else monitored on each device) is $4,395 for a perpetual license.
The NetCrunch network monitoring suite will let you monitor multiple sites in one, both with NetFlow/IPFix, sFlow/jFlow/etc plus Cisco NBAR as well as through SNMP. You can also generate PDF reports with your own custom logo. I work for AdRem, so if you do have any questions outside the regular channels you want answered, you can ask!
The NetCrunch network monitoring suite has a Visio-style diagram interface, with live widgets and device status. I do work there, but it's still a powerful network diagram tool!
NetCrunch costs a fraction of Solarwinds, with a similar feature set, and you can look for spikes through NetFlow/sFlow and SNMP. Caveat: i work for AdRem, but that means i can also help if you do have any questions.
Our freeware networking tools from AdRem Software all run on Windows: NetCrunch Tools, WMI Tools and MyNet Toolset
NetCrunch. It's an all-in-one and agentless network, server, application, file, log and web monitoring suite. It sets up in minutes, with preconfigured monitoring packs for 100s of popular software and hardware solutions. If you'd like some info outside of the official channels, just let me know :)
NetCrunch is an all-in-one network monitoring solution you can try. Not sure how much is small for you, but 50 nodes is $1,755 for a perpetual license. I do work for them, so if you have any questions that you want answered outside the regular channels just let me know.
NetCrunch 8 is an all-in-one and agentless network monitoring suite. The 50-node license is $1,755 for a perpetual license, with no limit on the number of sensors/elements/counters/etc. It can be remotely accessed via a desktop, web, and mobile client. We do offer 30 days of free tech as well as installation support if you want to give it a try.
Give NetCrunch 8 a try. It's an all-in-one network, server and application monitoring suite.
The 1000-node license is $6,596 at the EDU/GOV rate and the 2000-node is $10,552. We have a strong presence in the EDU/GOV sector, and you can check out some success stories here.
If you're looking for system monitoring, you can give NetCrunch a try. It'll do out-of-the-box server monitoring, and can also act as a log server and monitoring platform. I can help if you have any questions and don't want to go through the official channels. We actually have a case study from a former Splunk Sysadmin of the Year here.
NetCrunch 8 has just gone and fully upgraded their dashboards. They're vibrant, easy-to-read, and all dockable as well if you have a multi-screen NOC setup. Here's a view of the main Atlas dashboard. I work for AdRem, so if you do have any questions let me know!
NetCrunch 8 is an all-in-one network, system and application monitor. You can set up automatic corrective actions like running a script, rebooting a machine, or restarting a service. There's a built-in log monitor, and the embedded SQL database doesn't limit you in size or timeframe.
It might be overkill, but NetCrunch 8 can monitor your remote computers for connection and other problems, and assuming the installed AV software can write to event log or send syslogs, you can be alerted for problems there, too.
NetCrunch 8 does layer-2 mapping automatically, and the physical connection lines show bandwidth going along the connection, growing thicker with more usage. From a blow-up view you can drill all the way to an endpoint. It's also got the option for Visio-style custom maps that you can build, with dynamic icons.
How many servers do you have? NetCrunch 8 has a 50-node license for $1,755, which is a perpetual license. It runs on Windows, and is all-in-one server/network/application monitoring.
NetCrunch 8 licensing starts at 50 nodes. Alerting is via email, SMS, or you can have it restart services, reboot machines or run scripts. Most of your devices, including your Windows machines will be monitored out of the box.
NetCrunch 8 has an Exchange monitoring pack from the get go, and you can tweak it however you would like. It's not app-specific monitoring, but an all-in-one monitoring suite.
NetCrunch 8 is an all-in-one solution that fits the bill. The maps are dynamic, and can be drilled into exactly as you're requesting. 250 switches and 1000+ access points will be no problem, and unlike Solarwinds, it's also got an embedded SQL database, so you can store your data as long as you like, without paying for the additional hardware and licensing. Invest the time, and you can have maps of all of your monitored locations, with blueprints, and devices placed at their specific locations for visually identifying problem locations.
NetCrunch 8 features a physical segment map that'll show the physical connections between your devices, and the traffic rate like this.
This is literally the most commonly asked question on this subreddit, especially recently. There's also a huge wiki on this, albeit lacking in features. That being said, if you're a real person asking a real question, i would suggest giving NetCrunch 8 a try. It's an all-in-one monitoring and management solution, with a crisp and easy-to-use GUI. You can set it to trigger automatic corrective actions like rebooting a machine, running a script, or restarting a service which can save you tons of time.
OK, download NetCrunch and have it add your servers alone (or the rest of your network, but stick with servers for this example). Out of the box your servers are going to be monitored and have thresholds and alerts set. If you have some specific apps or services you need to keep up, you can set the software to restart the services if they go down or reboot the machines. NetCrunch will monitor 50 servers (nodes, so any devices) for well under $2000, and that's a lifetime license, with a year of tech support and upgrade protection.
EDIT: Looking at the website, they offer to inform your IT staff when something happens. They're just running monitoring software, and forwarding alerts to you. Cut out the middle man and just get monitoring software that alerts your IT staff directly, or runs corrective actions by itself. Save money, and have peace of mind that it's handled in house without having to rely on a third party. What happens when their connection to your network goes down? They can't see anything. Which means they won't know when something happens. If you've got something running on your own network, even if the internet is down, you can fire off an SMS to your team to let them know.
We offer workstation performance monitoring in NetCrunch, but through experience most users turn on the "Simplified Monitoring" option where no alerts or data are collected, no performance data is saved, and just network services are monitored. Even with the option, admins tend not to be interested in workstation performance.
Our NetCrunch network monitoring suite is an all-in-one monitoring solution with a similar feature set to many Solarwinds modules (like the NPM, SAM, Virtualization, Web, Log, etc.). Unlike Solarwinds, our database is embedded and offered with no size/time limitation or additional charge. Also, we are licensed by number of monitored nodes, with no limit on elements.
We're also much less resource intensive, and offer much greater scalability. Whereas a Solarwinds NPM server is limited to 12,000 elements (PRTG 2,500 sensors on a VM), NetCrunch supports over 650,000 monitored elements from a single server (VM or physical).
Try our NetCrunch network monitoring suite. We have full support for SNMP up to and including SNMPv3, and can build layer-2 physical segments maps that show live traffic on interfaces.
You can give our NetCrunch network monitoring suite a try. We are both Cisco and VMWare partners so there's full support there (as well as Microsoft). Interface throughput is available, including live displays, via the physical segments map. SNMP is also fully supported, including SNMPv3 and we have a built-in MIB compiler. It might be overkill for your personal network though, it starts at $1,755 for a perpetual license monitoring 50 nodes. As /u/cablethrowaway2 mentioned, i'm the NetCrunch guy, so i can help just ask.
There's tons of options out there to fit your budget and your needs, as well as your GUI preferences. I'd suggest trying our NetCrunch network monitoring suite. It's all-in-one and agentless network, server, application, file, log and web monitoring. SNMP is fully supported, including SNMPv3 but for systems we go without SNMP by default for security reasons.
Try our NetCrunch network monitoring suite. SNMP is at its core, with full support including SNMPv3. It comes precompiled with 3,500 MIBs but also includes a MIB compiler if you have lesser known or custom devices (instead of copy/pasting OIDs as others have you do). On top of that, we are massively scalable. A single server installation of NetCrunch can support over 650,000 monitoring sensors, even on a VM (compared to the single or low tens of thousands for many other products)
Give our NetCrunch network monitoring suite a try. It's all-in-one network, server, application, file, log and web monitoring. Free installation assistance is included, so we can help you get a POC set up.
The NetCrunch network monitoring suite will do the port mapping for you as most will, showing you what's connected on down the line. As for the port blinking... i'll ask our techs. I work for AdRem and i'll run it by them and let you know.
The NetCrunch network monitoring suite can act as a log server, and has an embedded, limitless NoSQL database. Our team offers 30 days of free tech and installation assistance to boot.
Our NetCrunch network monitoring system has NetFlow built in, along with Cisco NBAR. We're a Cisco partner, so Cisco support is comprehensive. You can also have top-talkers displayed as most recent polled data, hourly, or daily averages. The 50-node license is $1,755 for a perpetual license, and there's no sensor or other limits on what can be monitored on each node.
Nagios is very powerful, but can be time consuming to configure and manage. Spiceworks scales poorly. Why only those two options? They're not very similar. What are you trying to monitor? How big is your network? What kinds of devices? Etc. Either way, I'd recommend trying NetCrunch 8. It's an all-in-one and agentless network, server, application, file, log and web monitoring suite. We offer free installation assistance to help you get it set up on your network, and 30 days of tech support.
If you can pull a budget, give NetCrunch a try. You can get a permanent 50-node license (with no limit on sensors/elements/counters/etc) for $1,755. You'll get switch port mapping, physical segment mapping, traffic monitoring and analytics through our Flow dashboard, and more.
If you're looking for more scalability, give NetCrunch a try. Whereas PRTG is recommending a maximum of 2,500 sensors on a VM and 5,000 on a physical machine for best performance, NetCrunch is much more powerful. There's a recommended limit of 4,000 nodes, which would be 40,000 to 80,000 sensors. In lab testing, a single server is up to 240,000 sensors, and real-life applications have it being used at 150,000 sensors. I work for AdRem so if anyone has a question or wants info outside of the formal channels i can help.
You should check out NetCrunch. It's all-in-one, agentless, and has an embedded database. If it's just 10 servers you are monitoring, it may be overkill depending on what you want to do with it. I work for AdRem, so if you do have any questions i can help.
NetCrunch 8 can monitor you availability/bandwidth/resources, and alert on them in various ways. You can simply write to the log, receive and e-mail or SMS, or even run corrective actions like running scripts or rebooting the device. For management, you can not only generate regular reports, but you can create a profile for them where they can access NC8 via a browser, and browse pre-selected views or just the overall health dashboard without being able to drill deeper or make changes.
21 + the pair in the datacenter would fit in the 50-node license (no limit on the number of sensors), and that comes in at $1,755.
NetCrunch 8 has a similar feature set to Solarwinds (NPM/SAM/NetFlow/Virtualization), in an all-in-one package. As for taxing the equipment, it depends on the interval time that requests are being sent. As long as you're being reasonable, it should be fine.
NetCrunch 8 runs on 4GB RAM and 4-cores, and can be run on a VM. You can be responded via e-mail, SMS, or you can even run corrective actions like run a script, reboot a machine, or restart a service.
There are MIBs MIB2 for both devices, so any SNMP monitoring service could do it. NetCrunch 8 won't have an out-of-the-box monitoring pack for those devices, but likely has the MIBs, and if not, it's got a built-in MIB compiler. Data is also stored in an embedded SQL database, saving you the additional licensing cost there, and there's no limit on the timeframe/size of the SQL database. It's overkill for just two devices, but it'll handle your whole network, and unlike Solarwinds, it's all-in-one.
Monitoring is a pretty common topic for /r/sysadmin, if you do a search. That being said, NetCrunch 8 is a great all-in-one monitoring/management suite that provides real-time monitoring and has crisp dashboards for displaying data. You can also set alerts for event log events, and you can restart services automatically if they go down.
NetCrunch 8 has log alerting/management/collecting included as part of the larger suite of monitoring/management. It's also got an embedded SQL database for storage, so there's no additional licensing there.
NetFlow. NetCrunch 8 also does a physical segments map that shows bandwidth by physical connections, and you can just click and follow the thickest lines all the way to the hog.
A bunch of similar questions in the last few hours. An all-in-one monitoring/management solution like NetCrunch 8 can monitor either whether a file exists, or scan and alert based on content.
Free isn't free, it's nothing new. Nagios is free to get into, but you need to above all else invest your time into it. It all depends on how much you feel your time is worth, and whether a paid solution's license cost is worth the time saved, both in installation as well as upkeep. The all-in-one solutions at the lower end of the price spectrum like NetCrunch, PRTG, WhatsUp Gold, etc. don't have prohibitive entry costs, come with support, and are constantly being updated. Anyway, it's a moot point if your organization doesn't allow FOSS in the first place.
Nagios is the go-to choice here, or you can take a look at Spiceworks if your needs are limited enough. Their community is great. If you can find a budget, check out NetCrunch 8. It's agentless and will monitor your devices and servers out of the box. It's not free, but it's a price leader, and the budget can be justified in the time you're saving yourself, as well as network uptime. The automatic corrective actions can be especially useful if you've got a small team, set up to run scripts, reboot machines, or restart services.
Another day, another monitoring thread :) Try NetCrunch 8. The GUI is the best in the business, and the automation is a real time saver. Monitoring packs applied to devices by type makes monitoring tons of end-user workstations a breeze. Most of the commonly suggested systems are all pretty similar in what they offer. Find a GUI that you like and a price point that fits your budget. Open-source/Free solutions aren't free if you need to hire consultants, or have dedicated personnel maintaining them doing stuff that paid solutions automate.
NetCrunch 8 is completely agentless, and runs on Windows Server. It will monitor most of your OS and network devices out of the box. There's a built-in MIB compiler if the MIB isn't already included, and has very advanced SNMP capabilities. There's a web console that mimics the server and desktop consoles, albeit with a few features disabled for security reasons.
It's not FOSS, but the pricing is very competitive, and unlike other solutions out there, it's licensed by node (no limit on apps/elements/counters/etc). It's also all-in-one, and everything is included. No separate fees/modules for NPM, SAM, NetFlow functionality, etc.
We have quite a few manufacturers using our NetCrunch network monitoring suite at their plants (aerospace, automotive, food production, etc). You should be able to consolidate everything into NetCrunch without any problem. With a built-in MIB compiler and our Open Monitor feature there really isn't any limit to what can be monitored. Plus, the price point as well as scalability are much better than Solarwinds.
The software inventory feature built-in to our NetCrunch network monitoring suite will be able to show you. The 30 day trial is for an unlimited number of nodes and fully unlocked, so it'd be a quick and free way to take a look.
Try our NetCrunch network monitoring suite. If it's just a single server it's going to be overkill, but we do offer desktop, web and for you mobile consoles via any HTML5 supporting smartphone/tablet.
For the U.S. there is no sole distributor. Most people go directly, but if there are requirements for whatever reasons, any reseller can be used. SHI is the one i recommend if you do have requirements and don't already have a relationship with a preferred one.
NetCrunch is licensed by number of nodes (no sensor/counter/element/etc limit), number of remote access points (concurrent user connections via desktop/web/mobile console), and whether it's the Premium or Premium XE version. 50, 125 and 300 are available at the Premium and Premium XE (more enterprise geared) version, whereas 600 and above is XE-only.
Licenses are perpetual, and include one year of maintenance (tech support and updates). Yearly maintenance renewal is 1/3 the cost of a new license.
Premium 50/1: $1,755
Premium 125/1: $2,855
Premium 300/1: $4,395
Upgrading to 5 remote access points is +$770.
There is a 20% discount for EDU/GOV clients. There is also a 20% discount for agreeing to take part in a "success story". There is also competitive price matching available.
If you do want a quote or other info without going through the official channels, send me a DM and i'll be happy to help. In the UK, DACH, Benelux, FR, Canada, and Japan we have exclusive resellers, but i can still quote you (for what they would quote you).
You can cover logging and system monitoring with NetCrunch. It's an all-in-one network, server, application, file, log and web monitoring suite. We're a VMWare partner (as well as Cisco and Microsoft), and our embedded database means you can keep your data for as long as you like, without additional licensing or hardware requirements.
Try our NetCrunch network monitoring suite. It runs on Windows and only needs 4GB of RAM and 4 cores, which can be a VM (and currently supports up to 650,000 sensors on a single VM). It'll identify and begin monitoring most of your devices out of the box in minutes, and we offer free tech support as well as free installation assistance with a live tech through webinar. If you're already paying someone to manage your services, it'll pay for itself very quickly.
The NetCrunch network monitoring suite can do this, using data from SNMP or NetFlow, sFlow, jFlow, Cisco NBAR, etc if your devices support it. If you have any questions, i do work for AdRem so i can help outside of the official channels.
For monitoring check out NetCrunch 8. It's an all-in-one and agentless network monitoring suite, that will identify and begin monitoring your Windows servers out of the box. We do offer 30 days of free tech support, as well as free installation assistance if you want to give it a try.