What are
/r/technicalanalysis'
favorite Products & Services?
From 3.5 billion Reddit comments
The most popular Products mentioned in /r/technicalanalysis:
The most popular Services mentioned in /r/technicalanalysis:
TradingView
Yahoo! Finance
Cryptowatch
The most popular reviews in /r/technicalanalysis:
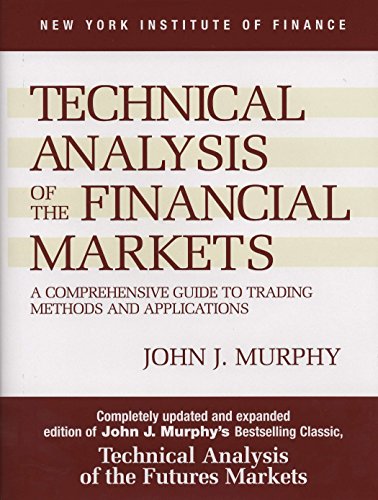
Here is the bible for technical analysis! Only book you will ever need!
I really like the book but if you're looking for online resources Chartguys.com has a free course on technical analysis. I am a member there and the community is really helpful and education focused.
Stock, no idea.. but for crypto.. https://cryptowat.ch/charts/BITFINEX:BTC-USD?period=1h
Has all the exchanges and all the coins..
Back in the day when I did stocks, back when google was an IPO and las vegas sands, etc.. I think I just used the trading platform provided by the broker.. Oh.. I did use a charting service provided by Investors business daily I believe back in the day.. the old Cup and Handle guy built that company, William Oneill? Not sure long time ago..
study over at tradingview.com use use a papertrading account based on yours and others theories. you learn by practicing. while not live.... its better to lose virtual $ then real $
I would suggest you to start with only one indicator for the beginning, like simple moving averages for example. There are plenty of videos to see on yt but if you insist on a book check out https://www.amazon.com/Moving-Averages-101-Incredible-Signals/dp/1515133966 and other books from same author.
The OP in this thread made some good points but he has a different option on EW’s use on indices than the guys who wrote the definitive book on EW They say EW works best on indices and markets with a lot of depth. It works less well the less money/volume is involved (eg penny stocks) and better on large cap individual stocks.
I suggest TradingView for charts as you can do a lot for free.
MACD is an important indicator for technicals, but any kind of oscillator will do to give you an idea of divergence, i.e. using some derivative of the price (slope) to find where it doesn't match the price peak-to-peak or trough-to-trough. This is important for identifying whether trend exhaustion and trend continuation is more likely.
Check out this book for more info on that: https://www.amazon.com/Trading-Divergence-Strategies-Divergences-Currency-ebook/dp/B01NALFY75/ref=sr_1_4?dchild=1&keywords=trading+divergence&qid=1629307536&sr=8-4
Also I would recommend that you start drawing peak-to-peak or trough-to-trough lines on any chart you're looking at, both for practice and to see where the price is relative to the current regime before making a trade.
E.g. if the price is at the top of a trend channel or approaching critical resistance levels, probably not a good time to open a long position. A better time would be when it's at the bottom of the channel and the smaller trend bringing it down looks exhausted. You'll be surprised how often trends stop and/or reverse at trendlines you draw. If they get invalidated by a move, delete them and redraw again.
I use a platform called Zerodha for trading. They have a site to learn all about it. It has a technical analysis course and as a beginner myself, I've found this to quite easy to follow through - Zerodha Technical analysis.
They have an app too - this has quizzes to test your understanding.
From here, I'd suggest you start identifying basic candlestick patterns, support & resistance levels, do some paper trading and take it from there.
TTM squeeze is just one of a few setups I use and like any other indicator it works great except when it doesn't. John Carter makes it sound way too easy having a bunch of red dots telling you to get ready to buy in. Having said that when I do trade it, it can return 100%+ on option trades.
If you're going to look into it you'll need to use it as a confirmation for price action; make sure there's a trend happening and set your own price targets. The last trade squeeze I played was for FB just a few days before the daily breakout on 6-Sept. The stock had been trending up for months and was testing 126.50. It then broke up $4-5 and my options went from $2 to ~$5.
When backtesting I found it works well for FB, AAPL, NFLX but sucks with DIS, IBM. I experimented using it on TSLA 1min charts during the first hour of the day but have since let that one go coz TSLA is crazy.
But yeh I'm still playing around with it to get a better hit rate, mixing it with MACD, 8EMA etc. If you haven't already, read John Carter's book, Mastering The Trade: https://www.amazon.com/Mastering-Trade-Second-Techniques-Profiting/dp/0071775145
It has a heap of great setups that I have since started using and seem to work pretty well, if you have an idea of what you're doing.


