
What is Reddit's opinion of
Wazuh?
From 3.5 billion Reddit comments
➔ Wazuh website
By popularity on Reddit, this Service is:
34 reviews of this app found across Reddit:
If this is all a bit new to you, I'd suggest going with a semi-managed service that can track Linux compliance.
These guys have the tools (OSSEC) to monitor compliance, as well as enact the security controls you are looking for: https://wazuh.com/
I know you specifically asked about two products, but this the internet so you get more than you asked for sometimes 🙂
https://wazuh.com/ might be of interest to look at.
I haven't played with it yet, currently looking at velociraptor, but it's a different use case to your needs I think.
Which ever you pick, ensure you monitor the dashboards for alerts, it is crucial to actually look at them.
You would think it would be obvious...it is not, I assure you.
Good luck with which ever choice you make.
Hi CloudTech412. If you managed to see the eventlogs in Windows then it seems to be only a rules configuration issue. I trust you removed already the negation of EventID 4663 from C:\Program Files (x86)\ossec-agent\ossec.conf on your Windows host. Could you share your /var/ossec/etc/rules/local_rules.xml file (in the manager host)? Specifically the block on <group name="windows, windows_security,">. It is important that you write the folder name correctly. Please also check the alert level of your rule. Rules level 0 are ignored, so you could try changing it to for example level 7. You can also comment out the following line to see if your alert reaches the manager.
<field name="win.eventdata.objectName">$CriticalFolders</field>
If it does, then you can try uncommenting it and fixing the folder name you provided. It is also useful if you enable <logall>yes</logall> and <logall_json>yes</logall_json> in the <global> section of /var/ossec/etc/ossec.conf in the manager host to check if the events and alerts are reaching the manager. Please have a look to the Rules syntax section of our documentation to check your rules are properly configured. And of course you can always join our Slack channel here: https://wazuh.com/community/join-us-on-slack/
Hi u/bigjon_97, Wazuh employee here. Let me try to answer this question.
Self hosted: as our platform is open source and free, you can download for free and you have an option to get the Annual Professional Support (Standard or Premium). The prices of the support are calculated according to the quantities of endpoint that you want to monitor (can be servers, workstations, network devices,etc.), and we have different bands, for example up to 25 agents, up to 50 agents, etc. Like you mentionted, in on-prem (whether or not you hired the support) the end user administrator needs to take care of the maintenance of this hardware and resources of Wazuh and Elasticstack.
Cloud-hosted: our hosting services host the Wazuh Server and Elasticstack, for which we will make the maintenance, upgrades of the latest versions, Support will be included (standard or premium), for which only the customer tend to install the agents and we take care of the rest. In this case, the prices are calculated according to the amount of hot storage needed, which is the events that are available in the Web User Interface (and is therefore processed by the Wazuh Analysis engine), and the retention period that you might need and the cold storage will be unlimited for 1 year.
In terms of features, both options have the same features/capabilities.
Hope this helps.
Let me know if you have further questions.
Regards!
Network segmentation
Don't expose applications to the WWW if they don't need to be exposed
Access network via a VPN
Having said all of that, I would love to get a WAF and Wazuh to analyse traffic
You could also take a look at the Wazuh project. https://wazuh.com/. It uses elastic under the hood and you can give your security team access. Isn’t of scouring through all the auditd logs you can setup rules for alerting on activity. You can ever run and automate you CIS benchmark.
u/michaelroadman2 if you want you can try connecting agents and see how Wazuh works with the trial version of Wazuh cloud without having to install the server.
It's been a long time since I tried using OSSEC but maybe that would help. It's a Host-based IDS, rather than a network based IDS like Snort. Last time I checked you could point it towards your logs and it will parse them offline similar to how Snort can read a PCAP file.
Wazuh is another HIDS that's variant of OSSEC. ELK would probably help too.
Does anyone know how many rules OSSEC has for web application attacks?
Hi u/DullAche, right now, you can ingest O365 audit logs into Wazuh by following this step-by-step Wazuh blog post.
However, as can be seen in this answer from a Microsoft employee, the Microsoft team plans to integrate the O365 management API into the Graph API, which is natively supported by Wazuh, so in the future, Wazuh will be able to collect O365 Audit logs without having to recur to the script from that blog post.
Please let me know if you have any more doubts regarding this.
Hi! Wazuh employee here.
First of all, a brief description of Wazuh:
It's a free and open source platform used for threat prevention, detection, and response. It protects workloads across on-premises, virtualized, containerized and cloud-based environments.
Wazuh solution consists of an endpoint security agent, deployed to the monitored systems, and a management server, which collects and analyzes data gathered by the agents. Besides, Wazuh has been fully integrated with the Elastic Stack, providing a search engine and data visualization tool that allows users to navigate through their security alerts.
Finally, please remember Wazuh is an open source project so if you have any doubt about it or its configuration, you can reach us via Slack, Google Groups or Reddit!. You can take a look into them, there are several questions regarding fortinet that you may find interesting. However, feel free to ask us and we'll happy to help!
Regards, Alexis.
Hi, Wazuh employee here! I think that you might be interested in implementing Wazuh in your company, it's an open-source SIEM that allows you to monitor not only the CVEs that could affect the software that your company uses, but also misconfigurations that could lead to attacks from malicious actors, intrusion detection -such as detecting brute-forcing attacks-, and many other interesting capabilities.
For clarification, there is no premium Wazuh version, if you self-host your Wazuh environment you get access to all the functionalities it offers. The company sells hosting, supporting and maintaining the Wazuh services for those interested, so there's no paywall at all.
Hi!
I am wondering why did you try to execute the python script on a different container, since I think that the best solution would be to run it inside the Wazuh container itself. Think of it as another part of the Wazuh manager, even if it is a custom one.
To do that you'd only have to either copy the script into the container or map a volume to the directory using -v path-to-script-in-host/script.py:/path-to-script-in-container/script.py
Then, by adding this configuration block to the /var/ossec/etc/ossec.conf file inside the Wazuh container -after adding your data- and restarting the service using service wazuh-manager restart the script will be executed every 24h
<wodle name="command">
<disabled>no</disabled>
<command>/path/to/script/office_365.py --contentType Audit.Exchange Audit.SharePoint DLP.All Audit.General Audit.AzureActiveDirectory --hours 24 --tenantId your_tenant_id --clientId your_client_id --clientSecret your_client_secret</command>
<interval>24h</interval>
<run_on_start>yes</run_on_start>
<timeout>0</timeout>
</wodle>
As for the best execution interval, I'd say that it really depends on the size of the environment you are monitoring, but I think that a 1h interval would be fine for a small environment and it would allow you to always have the most recent information available in the dashboard.
Please take a look at this post too since it has a lot of information regarding O365 integration with Wazuh.
Hi. Both deployment methods you already tried (Wazuh all-in-one unattended installation script and Wazuh using Ansible) create certificates. In order to change these certificates for Kibana you need to edit /etc/kibana/kibana.yml and replace
server.ssl.certificate: "/etc/kibana/certs/kibana.pem" server.ssl.key: "/etc/kibana/certs/kibana-key.pem"
with the path to your certificate and certificate key (or, without changing the configuration, replace those files with yours using the same file names). The new certificate and key should be automatically loaded. You can also do a Kibana service restart.
To set up a Wazuh cluster with NGINX load balancer there's a blog post covering the basics and the configurations needed here: https://wazuh.com/blog/nginx-load-balancer-in-a-wazuh-cluster/
I hope this is of help,
Yes, Wazuh messages protocol uses AES encryption by default. Communication between agents and manager as well as communication between manager nodes in a cluster is encrypted in this way. You can read more about AES encryption in the communication between agents and manager here.
Hi u/linuxgfx, glad to read that everything is working now!
User contributions to our communities are the best donations we can have, thanks to this we can continue to improve this amazing project. I invite you to join our other channels in which you will be able to find several use cases from other users, participate in discussions, talk to our developers and contribute to the project. Thanks again for using Wazuh, have a great one! cheers!
If you want to hunt rootkits, you may be better off with something like Crowdstrike or Carbon Black. rkhunter's last update was 2018.
If you want to track file changes (File Integrity Monitoring), Wazuh is a good free option - https://wazuh.com/
Hi u/two_word_reptile! yes it is!.
You can install an agent on the endpoint that is hosting the files and you can track all the changes ( created, modified o deleted) files on an particular location. Inside of every event you can see the information of the changes that the file had, like:
- checksumbefore and after the change
- User that made the change
- Diff of the file
- Etc.
In here you can find more information about this module.
You can also monitor share folder acces , more info here.
Hope it helps!
Regards!
Hello u/raphl87,
​
You have done such a great analysis.
I agree with you because the disk size depends a lot on what you are monitoring and how much activity the monitored system has.
​
One thing to keep clear is the matter of EPS. It's more precise to seize the number of Alerts Per Seconds APS, these are which Wazuh stores by default (Lots of events are muted and they won't consume disk storage).
​
Finally to your question Wazuh has a calculator that could give you an approximation of what storage you will need but, as you mention you have to take into account that could differ from reality.
​
You can take a look at the calculator here -> https://wazuh.com/cloud/ (After the standard and premium offer the link that says `How much hot storage do I need?`).
​
I hope my answer helps you, thanks for your feedback.
I would be surprised if Debian were actually leaving security issues unpatched. I would suspect that the tool may not be taking OVAL data into account, which tracks backported fixes rather than only correlating upstream release to CVEs fixed.
It looks like Wazuh's Vulnerability detector takes this into account for Debian -
https://wazuh.com/blog/detecting-vulnerable-software-on-linux-systems/
For SUSE systems without OVAL-integration in Wazuh, Uyuni or SUSE Manager is currently the best way to track this.
Okey that does not provides too much information. Send back your ossec.conf (/var/ossec/etc/ossec.conf) and your ossec.log (/var/ossec/log/ossec.log)
I also recommend you join to the Wazuh slack channel to help you solve your doubts https://wazuh.com/community/join-us-on-slack/
Look at opnsense as firewall platform they do have full featured IDS/IPS using suricata and have deep packet inspection option using this : https://docs.opnsense.org/vendor/sunnyvalley/sensei.html This is for network level IDS/IPS
For host level IDS/IPS check this one out : https://wazuh.com/
And for log collection check graylog : https://www.graylog.org/
Hope this helps!
To monitor it the logs on your agents, you can add it to ossec.conf like so
<localfile>
<log_format>syslog</log_format>
<location>/var/log/icmplog</location>
</localfile>
How are you telling the agents to log pings, where are your pings coming from, i block all of them except on the LAN?
While there is NOTHING wrong with OSSEC, if you want a more actively maintained fork of this as OSSEC is maintenance mode basically, try https://wazuh.com/. There is more active support, a growing community and people actually work for the company that provide free support on the mailing list.
Hello u/SiscoKidd, Wazuher here.
Since Elasticsearch version >= 7.x, Wazuh deployments no longer require Logstash to map the alert template to Elasticsearch due to the implementation of the Filebeat module for Wazuh, which now assumes such role. You can find further information about this as well as implementation details in this GitHub thread. Regarding your question, the hardware requirements don't depend on the number of agents, but on the EPS (event per second). Usually, Windows agents generate more events than Linux, but if you are using Audit in Linux, it may be very noisy. That's why there is no specific answer being only based on the number of agents, but a cluster composed of one master node and two workers might fit an average case with that amount of agents. Check out our documentation about horizontal scalability here.
I hope that helps, Feel free to join our Slack community :) https://wazuh.com/community/join-us-on-slack/
Cheers
Hi! sorry for the dealy, I made this alt account just for this and totally forgot, now after 17 days checking the inbox I see this.
You can join to our Slack channel from here: https://wazuh.com/community/join-us-on-slack/
But feel free to post any question here, several in the team are aware of this sub, and of course Reddit has much better discoverability than Slack, I'd hate spending time answering the same questions over and over on Slack when this sub could serve as a forum.
Only 80 machines? You can do everything yourself using FOSS tools and having some concrete playbooks. I have no attribution to the following:
https://wazuh.com/
https://www.ossec.net/docs/docs/manual/ar/index.html
Having spent the hours to download the ova file....just to install it on my server....allocate the 8 procs and 32 GB of RAM for it to still run like total crap....save yourself the time and trouble, it isn't worth it. If you are wanting something for just HIDS level detection, Wazuh has their own server platform as well for their agents. https://wazuh.com/ but I like SO because I can allocate sniffer ports and set up a SPAN/port mirror on a firewall or switch to dump the traffic to. This way it checks all of my traffic without interfering with it.
Hello u/krzivn, I think a Wazuh - OwlH combo could suit most of your needs by combining a HIDS (Wazuh) and a NIDS (OwlH). They are both open-source projects.
To set this stack you will need a machine to host the Wazuh manager (Wazuh also monitors the manager machine automatically), then you should deploy the agents in the target computers so they report the manager.
Then you should install and configure OwlH to monitor your network as Wazuh can also analyze the OwlH output. If you have a complex network with multiple subnets maybe you should do some kind of network traffic mirroring so everything is analyzed not just the traffic passing through the machine with OwlH.
Let me know if you have any questions about this stack!
Greetings, JP Sáez
Wazuh engineer here! Ping us if you guys have any doubt or any issue about the product.
We also have Slack for the community, https://wazuh.com/community/join-us-on-slack/.
And thanks for the post Security Onion.
Hi, Wazuh engineer here. You are looking for native solutions, our solution (free and opensource) is working always using low level system calls and it integrates things like audit at low level too. From my view, you should give a try to Wazuh, https://documentation.wazuh.com
In addition, you can join our Slack channel where our team can help you with any doubt you may have: https://wazuh.com/community/join-us-on-slack/
Regards!
We use as part of our HIDS solution, it's Wazuh, and we have a plugin for Kibana and we are fully integrated with the Elastic stack. You can read more about it at https://wazuh.com , or you can see our Kibana plugin at https://github.com/wazuh/wazuh-kibana-app
On a side note, all the product is free and open source!
You probably should have said Wazuh. I think you got downvoted, because it sounds like you are confused. LOL. BTW, isn't WAZUH a fork of OSSEC?
Anyway, since you seem to have experience, do you know if the Wazuh FIM solution supports integration with ITSM change management systems, so that authorized vs unauthorized changes can be tracked and detected?
Also have a look at unhide and unhide-tcp.
I've used it in the pass to find kernel module rootkits.
You can also install Wazuh HID, which started out as a fork of OSSEC but they have add a lot of features.
Also if you got some $$$ then look into Sysdig.
Edit:
For the netstat better to use netstat -tunapl and a easy way to remember it is "netstat tuna please".
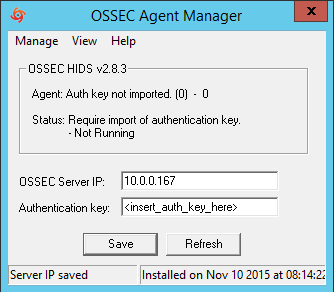
It works well...the Windows agent has no real GUI. It's essentially a small GUI to establish the ssh tunnel back to the server and restart the agent itself. All the magic really happens on the server-side. I use it as more of a FIM than a HIDS. I have all kinds of logging going on, but I use OSSEC to monitor file integrity on the hosts. This is all you get on the Windows side. Honestly, take a look at Wazuh. It's OSSEC at the core, with a much nicer webUI.