
What is Reddit's opinion of
htop?
From 3.5 billion Reddit comments
➔ htop website
By popularity on Reddit, this Service is:
16 reviews of this app found across Reddit:
Well probably one of the more interesting features is it being cross-platform. It's also easier to move around your meters and columns, and it has mouse support. There's more info on the official site.
IMO, yes, it's worth upgrading, but htop is an essential program for me.
Based on the screenshot, it looks ok as a resource monitor, but doesn't leave much room for the process list, so I'm not sure how useful it would be as a task manager.
I would definitely have it pick a default theme, rather than force the user to specify one each time. I wasn't able to actually use it though, due to an IndexError.
htop is still where it's at.
Because every body says it's better.
http://hisham.hm/htop/index.php?page=screenshots
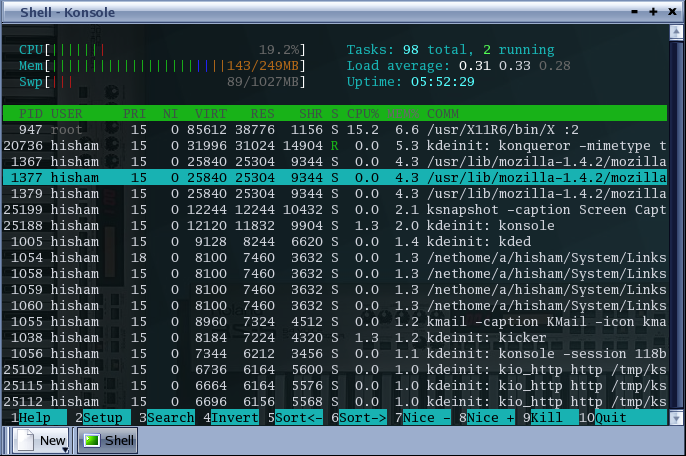
Comparison between htop and top
In 'htop' you can scroll the list vertically and horizontally to see all processes and complete command lines.
In 'top' you are subject to a delay for each unassigned key you press (especially annoying when multi-key escape sequences are triggered by accident).
'htop' starts faster ('top' seems to collect data for a while before displaying anything).
In 'htop' you don't need to type the process number to kill a process, in 'top' you do.
In 'htop' you don't need to type the process number or the priority value to renice a process, in 'top' you do.
'htop' supports mouse operation, 'top' doesn't
'top' is older, hence, more used and tested.
These are Text-based user interface programs. They differ from CLI applications in that they display a UI within a terminal window. They are local applications, but can be accessed remotely if you have a terminal connection to another machine. <code>htop</code>, for instance, is a that polls resources such as /proc/cpuinfo to display system statistics visually, and <code>Toxic</code> is an IM application that uses Distributed Hash Tables and asymmetric cryptography.
I'm guessing for you this stuff is actually useful and not just window dressing. Thats pretty interesting.
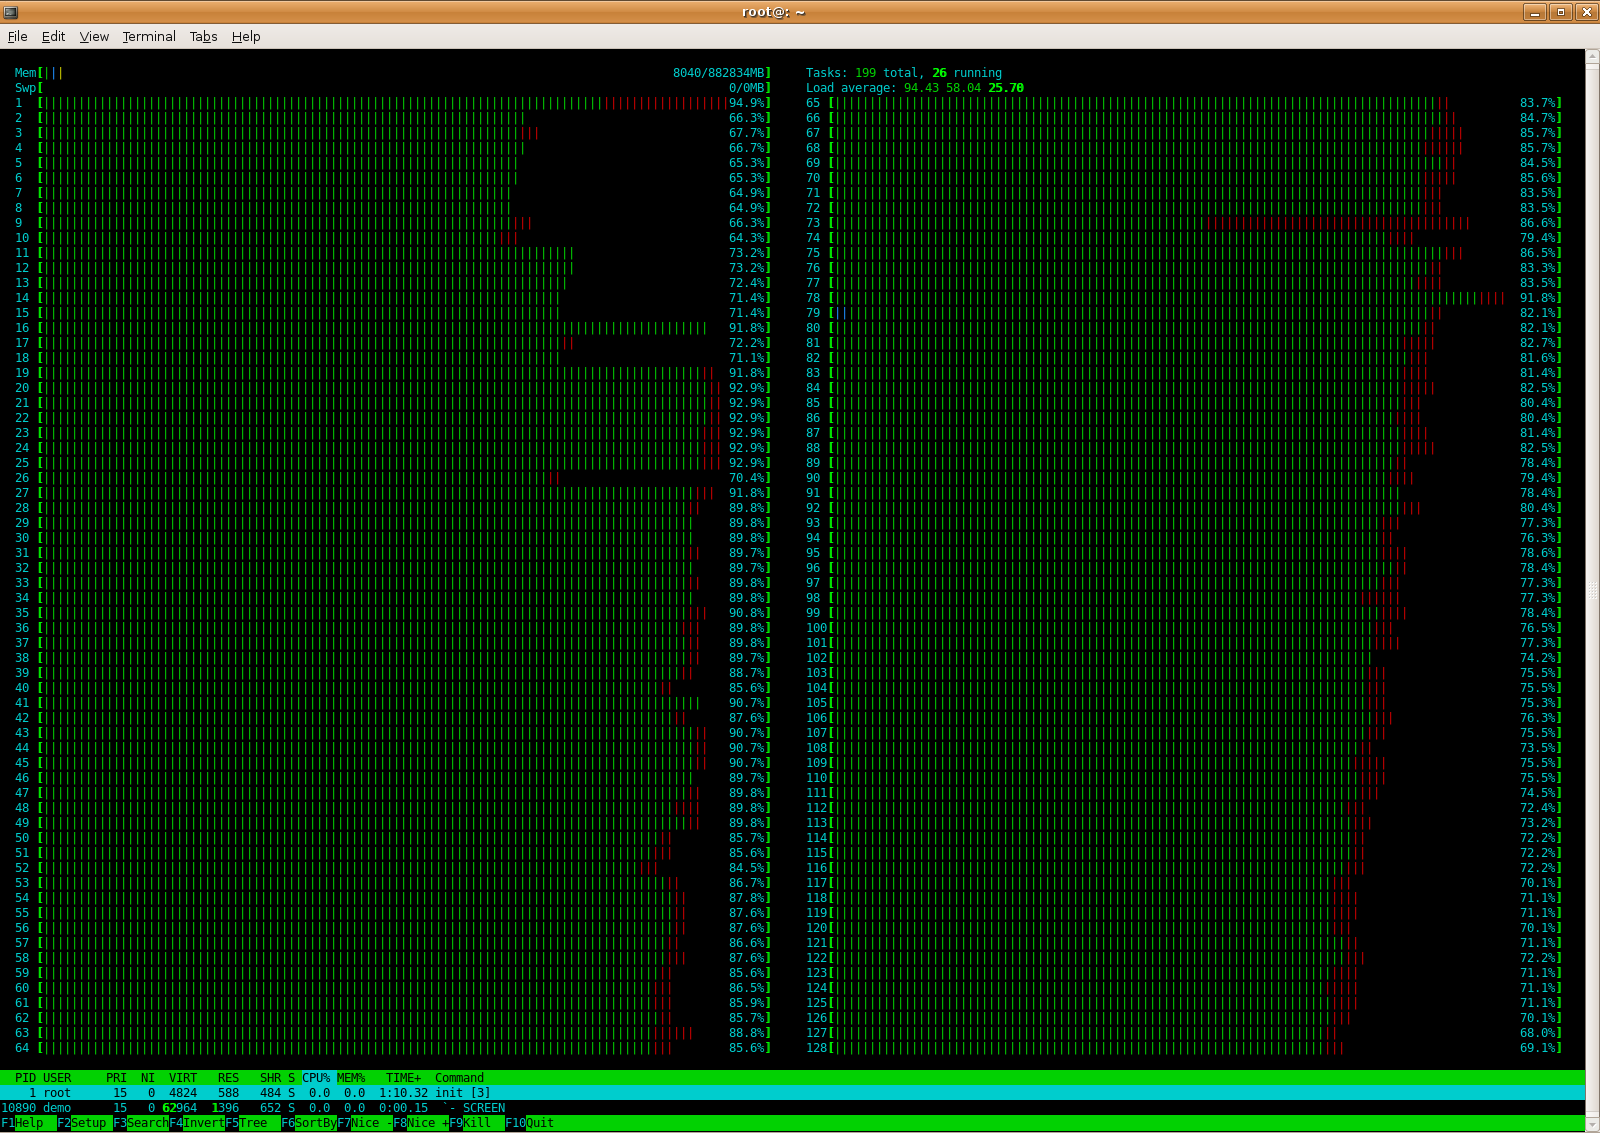
reminds me of this htop screenshot of a machine with 128 cores! http://hisham.hm/htop/128.png
If I had to reverse figure out how a server was setup, I would use scripts to dump all init.d processes (assuming it is not so new that it is using systemd). Then use other scripts to look at what it in memory, connections, etc.
Some favorites:
http://stackoverflow.com/a/137173/142018
https://github.com/pixelb/ps_mem/blob/master/ps_mem.py
Obviously look at rc.local if on a rhel flavor.
Basically everything in /etc/ is important to you. Since it does NFS you need to look at /etc/exports
Not something you are going to figure out in an hour but a weekend sounds plausible. Being new to linux is going to be problem though, best wishes.
Left is htop which is a pretty version of top. Center code is legacy C++ I was implementing a minor feature for. Right is my .vimrc. The ergodox/trackpad setup helps with RSI
> I currently use zsh with oh-my-zsh, zsh syntax highlighting and thefuck.
I also use antigen because I find it simpler to use. You just edit a few lines in .zshrc and done!
> One good thing is that fish is nice enough to tell you what it doesn't like, and in many cases will tell you how to fix it.
Yes, I like that feature from fish just as I like the way completions work. Plus, it comes with many features of zsh plugins out of the box.
> I guess you really need to ask yourself what zsh is lacking, and if fish has features that will be meaningful to you in your workflow.
I could say for sure that I would have jumped to fish if there was no zsh, but the advantages of fish is that it simply works: just install fish and edit the configuration file, done! That means it's easier to use in remote computers.
Anyway, the real reason I'd like to check newer shells is to see if I can make my work in the terminal easier: just like zsh is miles better than bash, there are still features that zsh lacks… better parallel support, more informative top (not text heavy, more like htop), better text styling (including using images) and printing an image (even videos?) to the terminal without opening a X window.
Ssh is really the easiest way to go, with htop doing most everything you asked for.
Htop as an easy system monitor.
Adding alias remine='/etc/init.d/minecraft restart' to your bash.rc will make things easier as well.
/u/LookAtMyKeyboard: The green bar in the memory usage is processes. Blue and brown are buffers and cache respectively. (See the F1 help page for more info)
There is no decent task manager on Android, especially one that would work on Nougat. Now, i'm not talking about these stupid apps that kill all of your processes to give you an illusion of "powersaving" and RAM "management" while harvesting your personal data. I'm talking about something like this or this. I had an issue where some app was using 100% of one core, making my phone hot as fuck. Android doesn't give me any tool to identify such app, other that the inconclusive battery usage stats.
Busybox has an implementation of top you can look at. When searching in the future it can be handy to include "busybox" or "coreutils". Busybox is a single executable containing the common functionality of many coreutils--it's used in things like Android and routers.
There's also htop with source code for a much nicer interface.
Cheers!
Do you have somewhere you can test-run this code while you monitor the cpu utilization? No reason to get an i7 if the code just leans on one thread the whole time.
CUDA is basically using your Nvidia GPU's insane throughput to do massively parallel computing. It looks like it's not unheard of to do monte-carlo with CUDA. This would probably be stepping outside the norm for both you and your professor.
Open up Ubuntu, open a terminal (it's like the command prompt in Windows, you should see it in the Applications menu at the top). It should look something like THIS. After you have the Terminal opened, type into it
sudo apt-get install htop
Enter your UNIX password which you set during the Crouton installation. This will install a program called htop. Afterwards, go back to the terminal and type
htop
You should see something like THIS. Now check how your system is using resources (top left corner). Is the CPU use high? Is the Mem useage high?