
What are Reddit's favorite Process Monitoring Apps?
Process Explorer
Glances
htop
Bashtop
Process Monitor
SystemExplorer
Monit
API Monitor
SpyStudio
Process Lasso
vtop
Process Tamer
MiTeC Task Manager Deluxe
TaskExplorer
Top Reddit reviews mentioning Process Monitoring Apps:
It gives you a download for a file that is named "Sound Plugin.exe", which some people will fail to recognize as a threat and execute.
In fact it is a 7zip self extracting archive, containing 2 files (obfuscated javascript and a visual basic script (that just pops up a message box saying "This program cannot be run in this OS")).
These two scripts get autoexecuted upon succesful extraction.
The beefy part is the obfuscated javascript. It would take me some time to decypher that one, but I see it may be getting some data from web server and execute them.
Edit: It downloads a few files. One of them is this 'https://www.myflare.com/0/io/hotlink/_nG281JOEeWxaAICrBEAbg/arhiv'. Password protected file containing some dll files and executables in systemx64 directory. I think I could find the password in the scripts, but I don't know if it is worth the trouble.
Edit2: The password is "BOSSLOVEMONEY" for anyone that would like to look inside, but you better know what you are doing!
Edit3: still interested? The code in the archive is some kind of exploit that connects to a server (some chinese-registered domain pudgenormpers.com) that probably gives it commands. Seeing that, I won't dig any further.
Edit4: Looking at the client32.exe binary, it seems to be this: http://systemexplorer.net/file-database/file/client32-exe/24839247
Software engineer and hobbyist sysadmin here. Steam performing a bunch of reads shouldn't put your performance out too much, assuming that you're not engaging in any other disk-heavy loads. Applications should still be responsive, nothing should lag, etc.
If you're seeing applications lag like they're not responding, and not just seeing applications take longer to do things, then there's a good chance you're low on RAM and your applications are being paged out of memory.
Yeah, buying an SSD will help the problem, but that's really only a band-aid; the real fix is to make sure you don't leave too many applications open, or if you're just running out of memory, consider getting more.
If you want to try to diagnose these sort of things, I'd recommend checking out the tools at Sysinternals. Process explorer is one of their most popular tools, but vmmap is handy for examining a single process.
Download the Sysinternals tool "Process Explorer" (here: https://technet.microsoft.com/en-us/sysinternals/bb896653.aspx )... launch it.. and go under the OPTIONS menu and turn ON the "VirusTotal" functionality. (it may make you agree to a EULA...,etc)
The "VirusTotal" feature... takes a snapshot of all your currently running processes --- and compares them against the virus-database up on www.virustotal.com .... that should tell you whether any of your current Processes are suspicious or not.
I'm not the most educated on the subject, but I came across the same problem and do have a solution.
It's not "forever," per se, but does seem to remove most of my noticeable input lag.
1) Download Process Explorer.
2) Open osu!
3) Run ProcExp as administrator.
4) Find "explorer.exe" on the list. Right click and hit "Kill process."
5) Find "winlogon.exe" on the list. Right click and hit "Suspend."
6) Under "winlogon.exe" should be "dwm.exe." Right click and hit "Kill process."
You should be free from the binds of Windows 8.
Note that you have to do this process every time you wish to play osu!, unfortunately.
After doing these steps, you will be unable to access the Start Menu, File Explorer, and other minute processes related to Windows.
To revive Windows 8, simply hit "File" on Process Explorer (hopefully you haven't closed it, or you'll have to restart), click "run," and type "explorer.exe." Hit "Ok," and your File Explorer will be necromanced.
Right click on the suspended "winlogon.exe." and hit "Resume" to revive the Windows 8. dwm.exe should reappear when you do this.
If anyone has a better solution, please share ;_;
Process Monitor will let you trace what your system is doing in alarming detail. Add a filter to exclude any process name that excludes Steam, launch Steam, and when it's done stop capturing (Ctrl-E, or the spyglass toolbar icon) and see what it recorded.
My observations: a good few seconds reading in .dll files, a lot of registry access, and quite a bit of file activity, including scanning savegames. Total of about 9 seconds with a warm cache.
Try doing the same and seeing if any particular type of activity stands out time wise, or if it's just death by 200,000 cuts.
Fire up Process Explorer, double click on the explorer.exe process, go to the "Performance Tab" and post a screenshot.
Then close that properties window, and while keeping explorer.exe selected, hit Control-D, which will open the lower pane showing what DLLs are loaded into explorer.exe. Sort by Path, and then hit Control-A to save it to a text file. Dump the text file here.
The usage is real if the "private bytes" or "working set" values are high. Virtual Size has nothing to do with physical memory usage.
The cause is usually something third party, whether it be something you intentionally installed, or from a virus/malware.
If you have anything installed that integrates with the context menus in Windows, consider uninstalling that. WinZip, 7 Zip, TortoiseSVN, Virus scanners themselves - these run some parts in explorer's process, and if they have memory leaks it'll cause your sort of problems.
Scan the list of DLLs that show up as loaded into explorer.exe, and see if anything looks suspicious. Find out what installed it and uninstall it. That's what I'll be doing if you post the list.
Any action that you take to try to fix this will usually only show up after explorer.exe gets restarted. You can do that either by 1) rebooting 2) logging out and logging back in 3) manually restarting explorer.exe while logged in (for instance, in process explorer, right click on explorer.exe and click restart).
It's possible your Anti-Virus scanners aren't finding anything because the Remote-Control/Access is a legit program (IE = if an exploit or trojan opened the Remote-Desktop ports or installed something like VNC or TeamViewer,etc)
If that theory is correct.. then your only option really is to go through your machine with a fine-tooth comb and look for any "remote-control" apps that YOU didn't install.
Alternatively.. you could use the official Microsoft Sysinternals tool named "Process Explorer" (download here: https://technet.microsoft.com/en-us/sysinternals/bb896653.aspx ) ... open/launch it and click on OPTIONS and enable the VirusTotal feature. The VirusTotal feature takes a snapshot/fingerprint of all your running processes and compares it to the virus-database up on www.virustotal.com .... and will tell you if any of your running processes are suspicious.
Another approach you could use.. would be to use a command like NETSTAT -A ... to view all open network connections.. and see where the traffic is going.
Use Process Explorer to see if the CMD is being called with arguments: https://technet.microsoft.com/en-us/sysinternals/bb896653.aspx
And Autoruns to track down the cmd entry (if there's a match): https://technet.microsoft.com/en-us/sysinternals/bb963902.aspx
(I'd start in the task scheduler.)
> If it is a Windows machine, you should reboot.
Sorry, but this isn't true anymore for the vast majority of cases. You should use tools like Task Manager or Process Explorer to see if the app is doing useful work and/or kill the individual process in question.
MS has a simple tool that gives you a reasonably detailed view of what a process is up to. I recommend it for people who aren't quite as up on debugging but understand how the Windows filesystem and registry work.
Fastest way to figure out what's going on:
If you download a program called process explorer by sysinternals, it will actually branch out and show you EXACTLY what processes are being spawned under that instance of rundll32.exe. From there you will find out exactly what's going on.
link: https://technet.microsoft.com/en-us/sysinternals/bb896653.aspx
I had the same memory leak symptoms [system crash after 2 hrs] and used process explorer to find which files were being accessed and not released back into free memory. Turns out it was an audio driver conflict with an external mixing unit I had plugged into the comp via usb. Removing the driver and unplugging the unit before starting Planetside resolved my problem.
Well probably one of the more interesting features is it being cross-platform. It's also easier to move around your meters and columns, and it has mouse support. There's more info on the official site.
IMO, yes, it's worth upgrading, but htop is an essential program for me.
Based on the screenshot, it looks ok as a resource monitor, but doesn't leave much room for the process list, so I'm not sure how useful it would be as a task manager.
I would definitely have it pick a default theme, rather than force the user to specify one each time. I wasn't able to actually use it though, due to an IndexError.
htop is still where it's at.
Yes, it does have too much information. The usernames are actually the biggest problem; the other information that actually means anything can be figured out by someone with relative ease should they stumble across the public IP address, or it's information that just doesn't matter.
One thing; PHP scripts that call server binaries directly are not a very good thing to have running on a publically facing server usually.
Public status pages should be traffic lights, possible with comments, but no more. This is more like a monitoring solution, albeit one that you actually have to look at rather than it reaching out to you when needed.
You're probably better off trying out something like monit to take proactive action and reach out to you should it need help, if it's just a single server you're planning on dealing with.
Because every body says it's better.
http://hisham.hm/htop/index.php?page=screenshots
Comparison between htop and top
In 'htop' you can scroll the list vertically and horizontally to see all processes and complete command lines.
In 'top' you are subject to a delay for each unassigned key you press (especially annoying when multi-key escape sequences are triggered by accident).
'htop' starts faster ('top' seems to collect data for a while before displaying anything).
In 'htop' you don't need to type the process number to kill a process, in 'top' you do.
In 'htop' you don't need to type the process number or the priority value to renice a process, in 'top' you do.
'htop' supports mouse operation, 'top' doesn't
'top' is older, hence, more used and tested.
I'm guessing for you this stuff is actually useful and not just window dressing. Thats pretty interesting.
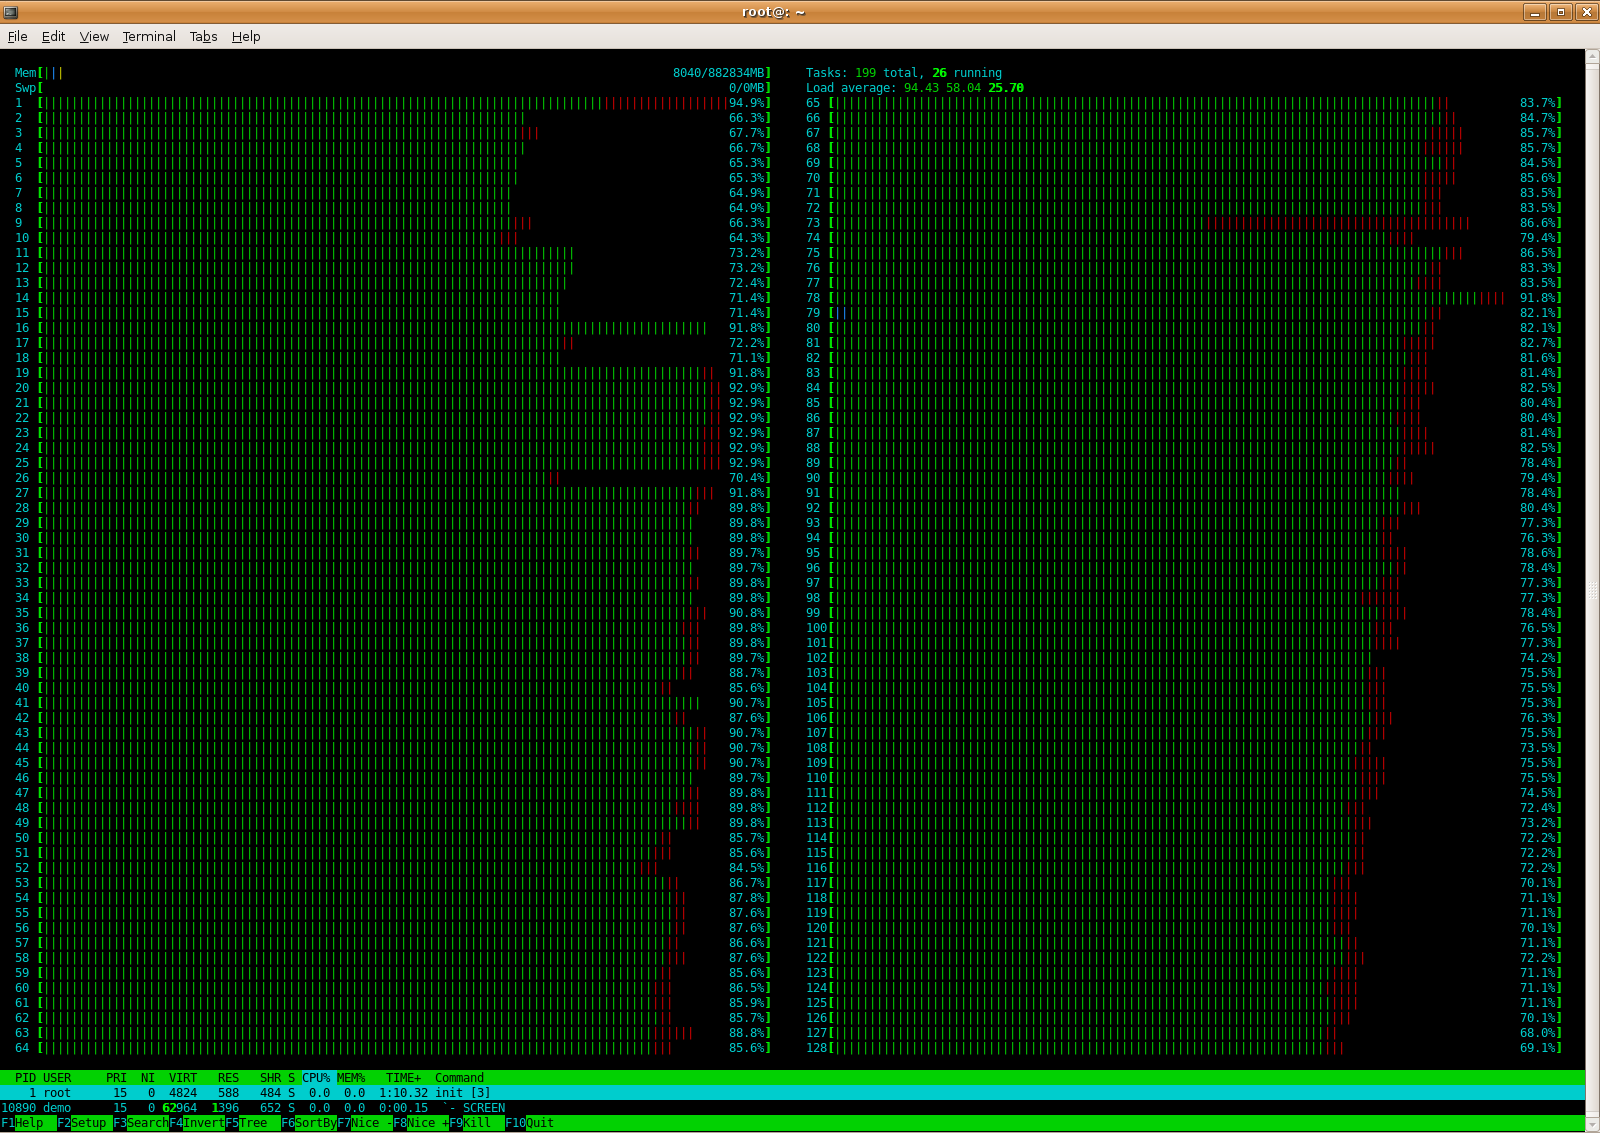
reminds me of this htop screenshot of a machine with 128 cores! http://hisham.hm/htop/128.png
I personally use Process Explorer - being able to track .dll problems with it and across everything running has helped in the past.
Havent uses system explorer though so cant compare the two.
Yes.
> First you will need to download Process Explorer and run it as administrator: https://technet.microsoft.com/en-us/sysinternals/bb896653.aspx
>1. go to \Heroes of the Storm\Support64\HeroesSwitcher_x64.exe and launch the game
>2. run Process Explorer as administrator
>3. select HeroesSwitcher_x64.exe
>4. press CTRL + L (shows lower pane)
>5. find "\Sessions\1\BaseNamedObjects\Heroes of the Storm Game Application" right click it and select close handle
>6. find "\Sessions\1\BaseNamedObjects\Heroes of the Storm IPC Mem" right click it and select close handle
>7. go to \Heroes of the Storm\Support64\HeroesSwitcher_x64.exe and launch another session of the game
>NOTE: You will need to repeat this process (close the 2 handles) for each new session of the game if you want to launch even more.
First you will need to download Process Explorer and run it as administrator: https://technet.microsoft.com/en-us/sysinternals/bb896653.aspx
go to \Heroes of the Storm\Support64\HeroesSwitcher_x64.exe and launch the game
run Process Explorer as administrator
select HeroesSwitcher_x64.exe
press CTRL + L (shows lower pane)
find "\Sessions\1\BaseNamedObjects\Heroes of the Storm Game Application" right click it and select close handle
find "\Sessions\1\BaseNamedObjects\Heroes of the Storm IPC Mem" right click it and select close handle
go to \Heroes of the Storm\Support64\HeroesSwitcher_x64.exe and launch another session of the game
NOTE: You will need to repeat this process (close the 2 handles) for each new session of the game if you want to launch even more.
I have not tested how the bot performs with multiple sessions since my SB key is limited to 1 session only.
A process invoking that file must be active on the system somewhere.
I would download and use Sysinternals "Process Explorer" ( https://technet.microsoft.com/en-us/sysinternals/bb896653.aspx ).. and make sure you go under the OPTIONS menu and turn on the Virus Total feature.
Get process explorer and run as administrator (right-click -> run as administrator).
Do you have anything new, taking a lot of memory now?
You might want to install Process Monitor and have it running while you play the games that stutter. Set up a filter in Process Monitor so that it logs only events from the game's .exe file.
Process Monitor will tell you all the files and devices your game is attempting to access. You may see it failing to access certain resources, or doing other weird shit. This may illuminate a light bulb in your head somewhere.
You may also want to install Process Explorer and keep it running on a separate monitor while you play a stuttering game.
You may see the CPU use of some other app oddly high while you play your game. For example, maybe something you installed is trying to render an overlay in your game and failing to do so. Maybe it supports some of your games but not others. This could be benchmarking software, a video card tuner, or maybe some bullshit service you didn't even know was installed that was bundled with a game or some hardware you bought. It could be some process that is listening for hotkeys, who knows.
You may want to install something like MSI Afterburner and put a bunch of its metrics on your OSD. Maybe for whatever reason some of those games are maxing our your VRAM or GPU or something.
Also, note that even older games like Mount and Blade have some video options that will stress even a modern video card, depending on drivers and such. You might want to take a poorly performing game and set it to the lowest spec possible and see if it still stutters. If it doesn't, incrementally enable shit and turn up the resolution until the stuttering begins to occur.
This is why I like lua mods.
Edit: a good av tool is actually process explorer because it can check all your running processes for viruses on virustotal. The reason this is good is because if you run gta and check your processes you can see if something is only running while gta is open.
Then install something like monit or another reactive monitoring system. Add a check that tests for the specific problem problem you have, and then restarts/corrects the specific service with the problem, and sends out notification to everyone so that you can continue working on fixing the root problem.
If installing a dependency is an option, on non systemd systems use something like Monit or Daemon Tools. If you are building your own daemon, it is probably going to be easier to use one of these than to write your own init script and juggle pids and stuff yourself.
Not sure if it works on Windows XP, as that OS is outdated and insecure, but System Explorer has a view that shows processes starting, closing, opened and closed TCP/IP connections and and high CPU usage. That list is limited to 1000 entries by default, but that limit can be lifted and there is also an option to save the log to a file.
Some tips to try boost performance on laptop:
- Make sure your laptop is using your nvidia graphics processor by default and not the integrated graphics (check your nvidia control panel)
- On nvidia control panel, manage 3D settings and add the Escape From Tarkov alpha .exe file and make sure to set the power management mode to be "Prefer Maximum Performance"
- Download System Explorer and run Escape From Tarkov, alt+tab back to desktop, open System Explorer, right click the EFT .exe file and set the process priority to High. Right click again and click permanent so that it will always be high when you boot the game.
- Download Unpark CPU and run it to unpark your CPU cores.
Just some general tips for anyone, even with a Desktop can use to try get better performance out of any game.
To be sure, read Reddits virus removal thread MalwareBytes is currently the favourite scanning/removal tool.
Yep - sounds like a stuck key indeed.
The other thing you could try is installing System Explorer This adds a small icon to your systray that looks like a monitor with a green performance graph on it.
Leave your mosue floating over the icon, and let the computer idle until it hits 100% When the CPU starts to rocket, the process eating up all your system should be listed there by filename
Google that file name and see whats found.
Do you have any sort of CPU or graphics card monitoring software (ATI/Nvidia)? I'm wondering do you have overheating issues since this started in the middle of a game when the CPU/GPU load is usually at it's highest.
If you like htop you should also check out glances. Great tool.
https://nicolargo.github.io/glances/
My favorite feature about it is that it sorts the list dynamically in order of importance based on certain metrics. If a process is using an unusually high amount of RAM, it will be at the top. If a process is sucking up a lot of CPU, that will also get sorted up top. It can be viewed through the terminal like htop or through the browser if you have it running as a server
Does your sysadmin per default enable hard disk encryption?
Is your laptop part of a domain?
If both of these answers are answered with Yes than it might explain the performance issue. Because encryption often cuts writing and reading speed in half. A domain also requires some services and programs to reauthenticate upon awakening of the laptop.
Your antivirus software may also play a role in this, if not properly configured it will check on writing and reading processes all the time, even those that could be excluded by the sysadmin because they belong to your "standard software".
Maybe your backup routin is triggered after a wakeup/start of the system? Or some kind of file sync? Check for that too.
If you want to inspect some of the issues try this:
https://technet.microsoft.com/en-us/sysinternals/bb896645.aspx
But I have to warn you, it may cause more issues/performance drops while using it. You definitly should set some filters and stuff. Or call your sysadmin and tell him to look for processes with many I/O requests.
Download Process Explorer and run it. On the top bar, click View > Select Columns.... Go to the Process GPU tab, then check all four boxes and hit OK. You can sort by those columns now, something must be using the GPU. What does it show?
> How do you do the hooking? do you patch the DLL the way Detours and EasyHook do? Or do you patch the import table?
We patch the api/function being hooked and take some extra steps when building the stub. For e.g., in x64 usually addressing is relative to RIP so when relocating, the code is changed to mantain the target address.
> Do you have a solution for protected processes like services.exe in Win2012?
Altougth this is not related to a hooking engine itself, when opening a process we try to setup SeDebugPrivilege if available. But it depends on o.s. configuration restrictions and all engines are affected in the same way. If not, it would be an o.s. bug.
> Do you perform injection using CreateRemoteThread to a suspended process or do you do it the way Detours does using an import table rewrite?
We do not touch the import table. In Deviare, injection is done via CreateRemoteThread/NtCreateThreadEx. In Deviare InProc, although it can hook remote processes, dll injection must be done by the user.
> SysInternals process monitor installs a kernel driver to intercept file-system/registry calls so unless you also do that, the output will be significantly different than what process monitor enables.
Yes it is different, but you can try SpyStudio. For e.g., when you open a key under HKEY_CLASSES_ROOT it may end in HKLM or HKCU. With ProcMon you see the end but you don't know that the app asked for HKCR. Sometimes it is important mainly in app virtualization.
Do you have unattended upgrades installed? There's a switch to have it install AND reboot, maybe that's why it rebooted?
There's been many threads on here about monitoring. If you're going to go the Nagios route, check out the OMD distro (http://omdistro.org/). I just started using it, check_mk is especially nice.
Something simpler would be monit (http://mmonit.com/monit/) which could email you about reboots and a bunch of other things.
I use http://mmonit.com/monit/ for basic monitoring of processes, file systems, etc. I had to customize each process/folder/whatever I wanted it to watch, but this means I only get emails for things I want (ie - memory limit reached, processes failing or restarting, etc.). Monit isn't quite the same thing as logwatch, but it might be able to fulfill the same purpose.
Then there are a lot of crazies out there :)
It’s all about picking the right tool for the job. Don’t overkill something with some elaborate python code or c code for example, when it can be quickly written in a unix shell. Don’t underestimate either, writing a full blown UI these days isn’t very efficient, but there are a few I’ve seen in the past that are impressive (and I would imagine written purely for the sake of it) and I don’t mean glue ui elements with external tools like zenity. For fun, and to be clear I have zero connection to this - only enjoy clever work as most can appreciate, check out bashtop ( https://github.com/aristocratos/bashtop ), looks like the author rewrote it in python now. None the less impressive for a pure bash tool.
Sounds like too many background processes could be running while you're trying to play the games.
Run them at minimum graphical settings, just for a short time, to see if there is any freezing still. If there isn't, I'm guessing that you have too much running in the background, and then the games are pushing your computer even harder at Max.
A good tool to use to determine how many background services/processes are running is System Explorer. http://systemexplorer.net/
Let me know what you think of my advice, and don't be afraid to ask me any further questions!
> Sysinternals Process Explorer
I used that for a bit but ended up switching to System Explorer. So far, I think I prefer System Explorer. But I'm not a game programmer or software developer, so maybe that's contributing to my preference.
Its basically a little GUI for linux that are CLI systems. I do not use it much but it is a nice snapshot if I do not feel like opening a CMD to check.
EDIT: A cli overview would be something like glances: https://nicolargo.github.io/glances/
I've been using Glances, I really like the minimal text aesthetic. Dead simple to set up. Probably not exactly what your looking for though, not so much a dashboard more of a server monitor, but it can be exported to Grafana.
Start unplugging machines ;-)
Seriously, I think you should change methodology. No two machines/users/processes on a network should ever be competing and writing over or appending to an existing file on a server.
That being said, I'd look at setting up tracers in Process Monitor for the user and processes involved in creating the file.
As your next step, I would follow cyanogen's advice - uninstall it, and nuke every last folder in your user profile that it could be storing data. Maybe create a temporary new user on your computer and try running it from that user to see what happens?
Barring that, I have only one more really nasty answer - open up SysInternals' Process Monitor, watch Chrome while it's starting up, and try to find out what files it can't read/write to and figure out why. It's not a great answer since you're going to have to wade through a ton of crap to get to what you need.
taskmanager -> check what taking resources (cpu/mem)
combo with "resource monitor" ... the disk monitoring function should easily spot what taking disk io
if need more depth analysis u can use process explorer/monitor https://technet.microsoft.com/en-us/sysinternals/bb896645.aspx?f=255&MSPPError=-2147217396
hope helps
SMB sucks over high latency links. Even with some of the fixes added for SMB2 it still isn't perfect.
Keep in mind that opening an office document isn't simply reading the content into memory, it creates temporary files in the original location, for auto-save features.
If you want to see, you could open procmon and see what all you are actually doing over the wan link when you open the file.
Left is htop which is a pretty version of top. Center code is legacy C++ I was implementing a minor feature for. Right is my .vimrc. The ergodox/trackpad setup helps with RSI
I said this in another comment, but this might be helpful knowledge if you ever run into this kind of problem again:
I think there is a temp or cache file somewhere in the system that preserves info that said the game was running, and that probably initiated on startup, even after you rebooted the computer. A restart in safe mode (if it still exists) would solve that kind of problem, probably. It takes a lot of digging through running processes (usually ones you can't see with normal task manager) to find and isolate the cause of the problem. The Process Explorer tool (completely different from built-intask manager; you even need to separately download it) could probably help find it, because it finds absolutely everything. It's available at https://technet.microsoft.com/en-us/sysinternals/bb896653.aspx Tutorials are very helpful when using that tool, it's not very intuitive for first-time users.
I only know this because I'm a developer and have had to fix these kinds of problems in the past.
SuperF4 should do the trick. You can also use proper task manager like Process Explorer and kill it from there. Both can kill apps without giving them a way to prevent that.
Honestly, heavy SP3 user here, and I've gotten 1 blue screen (gpu driver issue that must have been taken care of in an update). I've had it shutdown for thermal issues 1 time (during the initial setup when transferring files, doing updates, and installing programs all at once). When I'm running data analysis or playing games I get ~3 hours, but regular note use usually lasts ~5 hours. For several weeks I went to a coffee shop daily between 12 and 5-6 to work on my thesis, meaning I had Firefox, OneNote, Word, Matlab, Acrobat, and a few other programs running, and would leave when the battery warning popped up at 10%. Your experience sounds very atypical.
Have you tried a factory wipe, or at least hunting down rogue background processes with something like Process Explorer? Could also be a hardware issue. Blue screens are really rare, actually, which makes me think this is a driver or hardware issue. I would at least do a wipe before running off to the land of capacitive styluses (ew). I can't imagine always taking notes with my hand hovering over the screen.
I've heard some people have issues with the Windows 10 update. Did you update to 10 and do the recommended things like disable the 'hints about Windows' feature and deactivate background apps? Have you tried using the Modern OneNote version instead of eh desktop? I've heard it is more battery friendly (though I only use the desktop version, which has an option to extend battery life by delaying recognition).
If you use process explorer in administrator mode it will help you track down whatever bundles and/or channels are causing this.
Also, I recently had this problem due to networx bandwidth logger, some TDI drivers used by bandwidth management/tracking programs will cause interference with Plex and/or P2P applications.
http://howtoremove.guide/remove-ads-by-dns-unblocker/
.
Edit: Obviously, if this still doesn't work. Reinstall your OS. Keep your UAC turned on (and run in a non-admin mode which will require a password to install stuff... annoying but effective against future issues like this). Adblock, Ghostery, a good firewall like pfsense/opnsense/ipfire with squid3/HAVP/Dansguardian/privoxy... and just the generic "don't install stupid shit, and don't let stupid users use your desktop" also goes a long distance.
I haven't ran antivirus in over 10 years and I've never had a virus. Just be smart about it, educate yourself. Don't install crapware and stay on the good side of the internet and you should be fine. (also use virtual desktops if you really have to visit the shit parts of the internet so you can just delete that instance or roll back from a snapshot).
Another very useful tip is to use a Microsoft app, that doesn't come stock, called Process Explorer. It can submit running process app hashes to Virustotal so you can see if the running processes are infected. It's not an antivirus, but it's a good "is this shit infected" tool... plus a lot more. Like Task Manager on steroids.
Good luck.
I would download Process Explorer and see what's really eating your CPU. It's a program from Microsoft that's basically Task Manager on steroids; it shows a lot more information about running processes and can help you pinpoint what exactly is causing the problem.
no but connecting to different servers will provide you with IP #s and let you measure hops with an external tool. sysinternal's Process Explorer will show all network connections for a given process; plug IPs from that into your hop measurement tool and away you go.
So when dealing with high CPU usage you need to find what program is causing this. This can be accomplished a few ways. One way is to open up your task manager and look at the process list. this will show which have the highest ram usage(generally high ram usage means high cpu). Another way is to use process explorer(microsoft): https://technet.microsoft.com/en-us/sysinternals/bb896653.aspx
With process explorer it will show you better usage graphs. If you watch the top right there will be some small graphs going by. If you see a spike double click the graph and it will pull it up larger. You should then be able to hover over the spike and it will tell you the exe causing the spike. Then start researching why that program might do that.
First thing is first, you want to find out what is using the svchost.
Use THIS tool to see all of your processes, and hover above the SVChost process to find out what is running.
When you hover above that, it's going to look similar to THIS That should help you on your way to figuring it out.
Your next best bet is to download ESET, Malwarebytes, Malwarebytes anti rootkit, and Roguekiller - run all of this stuff in safe mode.
If you come out clean, then try looking into Event Viewer for more clues.
For future reference try out process explorer and autoruns. Really these two tool tools should be just about all anyone ever needs to disinfect their PC unless it was hit with something a reinstall can't fix either.
These 2 free programs offer what I believe you are looking for:
These are Windows specific applications.
Yes it is capable of hooking any api with at least 5 bytes of code. Usually there exists gaps inside +/- 2gb region from the api being hooked that allows the hooking engine to put some code.
In our tool SpyStudio we hook more than 100 functions without problems.
If it is just a single server you could use monit. It can send email notifications, and automatically restart services if they fail. I've been saved a couple of times from having to travel to remote sites as it's restarted sshd for me :) M/Monit for multiple hosts charges, but single host is no cost.
I don't know of any product that would do that out-of-the-box. Monit can monitor services and even test basic HTTP functionality but for what you're looking for, you would probably need to create custom Selenium scripts that do these tests for you and then run them from your monitoring system or cron or whatever.
Check out monit. It can monitor ICMP and files too.
Really simple to setup, after you install it, check out its default configuration - it contains several examples.
have all of your servers log to a central syslog server and use logcheck to monitor and notify you of interesting activity. for custom actions, you could run 'monit' on each server itself (http://mmonit.com/monit/documentation/monit.html#file_content_testing is one way to watch logs, tho i dont know off the top of my head whether it knows where it left off on its last check or if it parses the entire file again on each run. the latter could be a problem if logs get large). there are lots of other ways to verify services are working properly as well. alternatively, you could combine 'logtail' (logcheck utility) with egrep, regexes and monit.
There are, but your database is more reliable than they are. Just monitor everything.
> Or is there a better way to notify the admin if the webserver or database goes down?
You are looking for monit.
Maybe look into git tagging to tag versions, to make it easy to switch between versions (for example for testing). You can also populate GitHubs Release page with for example an changelog (you could also include that information in the annotated tag itself, so it won't get "lost" when moving off GitHub or something).
Some tips:
Install it on an SSD if you have it
Make sure to unpark all your CPUs, you can use this to do so - http://www.coderbag.com/programming-c/disable-cpu-core-parking-utility
Download System Explorer, it's a program that can allow you to permanently set .exe processes to always be high. (Right click Dayz's exe when running, set process priority to High, right click exe again and check "Permanent")
Go onto your nVidia Control panel and add DayZ's exe, set the Power Management Mode to "Prefer Maximum Performance"
Check in your nVidia Control Panel that your graphics processor is set to your nVidia graphics by default and not your integrated graphics
Unfortunately I don't think there is anything to do this built into Windows. Some software like system explorer can do it but you can also create shortcuts that will launch it with a specific priority
Okay, that crash seems to be happening in something called qipcap.dll, which appears to be from something called "Websense Data Endpoint". Uninstalling that should stop the crashes.
> rkcl.exe
http://systemexplorer.net/file-database/file/rkcl-exe
This lists the file as having been discovered yesterday, so whatever it is seems recent. There's no corporate signature or stuff, so who knows what it comes from?
If you want to be sure about the process who take/steal CPU time use http://systemexplorer.net/ to clearly see when you move your mouse what is the process that use CPU time... http://systemexplorer.net/onlinehelp.php?t=processes
Let me know after that I will be more able to help you to resolve it !
Your best chance is to find some task manager alternative. I just tried this one (I downloaded the portable version) and it has it.
Weirdly enough, Process Explorer (the best one around) doesn't seem to have that column.
Glances?
https://nicolargo.github.io/glances/
It can both work in a terminal or export its data to a Web UI if need be. And most current Linux distributions already have it in their repositories, or even ship with it out of the box.
To get health/performance stats, I strongly recommend glances: https://nicolargo.github.io/glances/
As others have said, to do stuff like restart, you could easily set up ssh scripts and whatnot, but as I don't have that set up, I don't really have good examples for that.
Well, it is true that if the code is run in a browser, it may not really matter all that much but there still has to be OS specific codes in it.
Personally, I never have any taskbar or menubar visible, they are always set to autohide so this popunder would not work, it would be visible and I'm always running Glances in a terminal.
If netdata won’t do try Glances. It uses Psutil for gathering stats. Although I’ve never tried it in docker I know there is installation instructions for docker.
Edit: here’s the link
You might want to have a look at Glances. It's not a perfect match for what you want, but it comes pretty close. There's a built-in web server mode, so you can access it from other systems on the network without needing to RDP in. The only downside is that it doesn't collect historical information, though it can export data to something like an InfluxDB/Grafana stack for collection and graphing.
Could you use something like Process Monitor (https://technet.microsoft.com/en-us/sysinternals/bb896645.aspx) and check if there is any special file activity going on while this happens? If you enable packaged app debugging in vivaldi://flags and inspect the UI (right click any UI element, select Inspect), and grab a profile session from the Timeline, it could help to see if the problem is on the web UI side of things. Very technical, I know, sorry.
Okay so the files keep coming back. I got an idea while searching around. Seems you can specify a folder and see what process changed something in it. This could be a way to know what creates those files. The utility is called process monitor: https://technet.microsoft.com/en-us/sysinternals/bb896645 I am not at my computer right now so I can not test run it so I can tell how to use it. I come online later and then I will try it.
Kristian818
Try Process Monitor to figure which files/registry values are fiddled.
Maybe it'll give you a clue.
https://technet.microsoft.com/en-us/sysinternals/bb896645
Anyway, I'd advise to contact Logitech again.
If they continue to get created in the future, you can use Process Monitor to find out what is creating them.
ProcMon Tutorial: http://www.howtogeek.com/school/sysinternals-pro/lesson4/all/
Okay, that's information that we didn't have before. Borderlands has never worked at all on this current system of yours.
You say in another reply that you're messing around with VC. Launching borderlands.exe under the debugger could be enlightening-- you might observe a DLL dependency chain failing.
edit: Or try this.
Yeah, that rundll32.exe seems suspicious. I would install Process Explorer like /u/russellvt said. Double-click on the rundll32 process, and you'll be able to see it's "command line", which will show you the DLL file and function it's running. After that, you'll need to do a web search and research any info about what it's doing.
Also if one of the svchost processes really is the main culprit like you say, find the one that's using a lot of cpu/memory and double-click it in Process Explorer. In the "Services" tab it will show you what services are being hosted by that particular svchost.exe process, which can then help you narrow down the possible cause.
And lastly, I would use Process Monitor which is also part of the Window Sysinternals suite. With that you can create a filter and actually see what files rundll32.exe is reading/writing.
Process Monitor in boot-logging mode might be able to shed some light. e.g. this article diagnoses a slow boot using it.
Mr Russinovich is your friend here with another great sys internals tool Process Monitor
Process Monitor is an advanced monitoring tool for Windows that shows real-time file system, Registry and process/thread activity. It combines the features of two legacy Sysinternals utilities, Filemon and Regmon, and adds an extensive list of enhancements including rich and non-destructive filtering, comprehensive event properties such session IDs and user names, reliable process information, full thread stacks with integrated symbol support for each operation, simultaneous logging to a file, and much more. Its uniquely powerful features will make Process Monitor a core utility in your system troubleshooting and malware hunting toolkit.
Have you attached ProcessMon to the process to see which part of the file system the program is touching?
Might give you some insight into caching/temp files.
> I currently use zsh with oh-my-zsh, zsh syntax highlighting and thefuck.
I also use antigen because I find it simpler to use. You just edit a few lines in .zshrc and done!
> One good thing is that fish is nice enough to tell you what it doesn't like, and in many cases will tell you how to fix it.
Yes, I like that feature from fish just as I like the way completions work. Plus, it comes with many features of zsh plugins out of the box.
> I guess you really need to ask yourself what zsh is lacking, and if fish has features that will be meaningful to you in your workflow.
I could say for sure that I would have jumped to fish if there was no zsh, but the advantages of fish is that it simply works: just install fish and edit the configuration file, done! That means it's easier to use in remote computers.
Anyway, the real reason I'd like to check newer shells is to see if I can make my work in the terminal easier: just like zsh is miles better than bash, there are still features that zsh lacks… better parallel support, more informative top (not text heavy, more like htop), better text styling (including using images) and printing an image (even videos?) to the terminal without opening a X window.
Ssh is really the easiest way to go, with htop doing most everything you asked for.
Htop as an easy system monitor.
Adding alias remine='/etc/init.d/minecraft restart' to your bash.rc will make things easier as well.
You can use Process Explorer to identify the window. Explanation of how here.
This will tell you what process/program created the popups so that you can either uninstall or carry on with troubleshooting that application.
It's actually very lightweight. Aside from the Scintilla editing component contained in SciLexer.dll, it only loads OS components.
https://i.imgur.com/bwAhWyX.png
You can see for yourself in Process Explorer. Just use View → Lower Pane View → DLLs. You'll see in my screenshot the reality isn't as rosy, besides Notepad++, its plugins (which aren't protected yet, even when they're coming from Don himself), the system DLLs (most protected by Windows against tempering during runtime) and the components of the C++ library there's also Office 2010 components injected via the SharePoint shell extension.
why would you want it in a graphic when text is so much more useful? it isn't like having it in fragments in memory is going to really cost like it would in a magnetic storage device (sata, pata, scsi, sas)
https://technet.microsoft.com/en-us/sysinternals/bb896653.aspx
process explorer may be the best out there for current operating systems. There used to be something for windows 3.1 way back when on 16 bit oses, due to important files having to load in the under 4mb block...you know when 4mb was a lot of memory and 8+mb was expanded memory and I vaguely remember a graphic (though it may have been in a text book, going deep...perhaps in a memory manager or norton utilities from back then). A gigabyte of memory was a pipe dream back then, even gigabyte drives weren't available.
rammap will give you more info but again it is all text based as graphic really doesn't matter all that much. https://technet.microsoft.com/en-us/sysinternals/rammap.aspx
Seems like complete overkill when you can simply do this (credit: /u/joethehoe27 )
First you will need to download Process Explorer and run it as administrator: https://technet.microsoft.com/en-us/sysinternals/bb896653.aspx
go to \Heroes of the Storm\Support64\HeroesSwitcher_x64.exe and launch the game
run Process Explorer as administrator
select HeroesSwitcher_x64.exe
press CTRL + L (shows lower pane)
find "\Sessions\1\BaseNamedObjects\Heroes of the Storm Game Application" right click it and select close handle
find "\Sessions\1\BaseNamedObjects\Heroes of the Storm IPC Mem" right click it and select close handle
go to \Heroes of the Storm\Support64\HeroesSwitcher_x64.exe and launch another session of the game
When even the sound stutter it is usually a cpu choke or something that use too much kernel time and mess up multithreading. Try to check it with process explorer. Sometime BES can be used as a workaround (limit the cpu to -3% instead of the default -35%).
The message is coming up because something on your computer is trying to access an L: and N: drive, which do not exist on your computer.
It can be difficult to figure out what is causing it. You may want to check your machine for malware.
You might also be able to try Process Explorer https://technet.microsoft.com/en-us/sysinternals/bb896653.aspx?f=255&MSPPError=-2147217396
Open it the next time you get the popup error (leave the error on screen). In the top menu bar, click and drag the bulls eye icon to the window. It will highlight the process that is showing the error. If it is something other than Explorer.exe, then you might have found what is causing it.
https://technet.microsoft.com/en-us/sysinternals/bb896653.aspx
hoping this still works in windows 10, basically you can expand whats behind the svchost, what the program is.
Mouse over the svchost taking all the cpu power and it shows the processes under it.
download and run this: https://technet.microsoft.com/en-us/sysinternals/bb896653.aspx
it will break down processes giving you a much better look at what is going on. You can use it to close off subprocesses one at a time to nail down the culprit.
You can use the task manager and go into processes and add the Threads(I think that's the column) name and see how many it shows. Also Sysinternals has a great process explorer that breaks the threads down and shows the CPU use of each one.
I suppose it all depends on how you want to approach it.
If it was me... I'd probably scan with a variety of tools:
- TDSSKiller
- adwCleaner
- Microsoft Safety Scanner
- NOD32 Online Scanner
- Hitman Pro
You could also download Sysinternal's "Process Explorer" ( https://technet.microsoft.com/en-us/sysinternals/bb896653.aspx ) .. and make sure when you download/unzip/run it.. that you go under OPTIONS and turn on the VirusTotal feature.. which will calculate a hash of all your active processes and compare them up to the database on www.virustotal.com. (You may need to CLOSE and Re-open Process Explorer to get this feature to work correctly.. I've noticed it's a little flaky).
Netstat-a ... is just a DOS / Command line utility. So all you have to do is go out to a COMMAND PROMPT and run it like this:
NETSTAT -a
and it will echo back and show all your TCP/IP connections.
open that, right click the top bar of the columns to select new columns. Under the 'Process GPU' enable 'GPU Usage' and figure out what's using it
"upd.exe" is most likely the "Update Checker" for Microsoft Lifecam software.
The blue-light coming on (seemingly) randomly.. is probably the webcam either being "PING"'d by its own software... or some other software like Skype or Webex or etc.
If you're paranoid about it.... do some system scans with a wide variety of utilities such as:
- TDSSKiller
- adwCleaner
- NOD32 Online Scanner
- Microsoft Safety Scanner
- Malwarebytes
- or use something like Sysinternals "Process Explorer" ( https://technet.microsoft.com/en-us/sysinternals/bb896653.aspx ) and go under the OPTIONS menu and turn ON the "VirusTotal" feature which takes a running snapshot of all your active system Processes and compares them (in real time) to the database up on www.virustotal.com .
You have to somehow get Process Explorer running and see what is taking up all the drive time. Download and right click "run as admin" so you can kill processes. This can be a tricky one to figure out. A lot of googling involved. Cuz it's Windows.