
What is Reddit's opinion of
Glances?
From 3.5 billion Reddit comments
➔ Glances website
By popularity on Reddit, this Service is:
25 reviews of this app found across Reddit:
If you like htop you should also check out glances. Great tool.
https://nicolargo.github.io/glances/
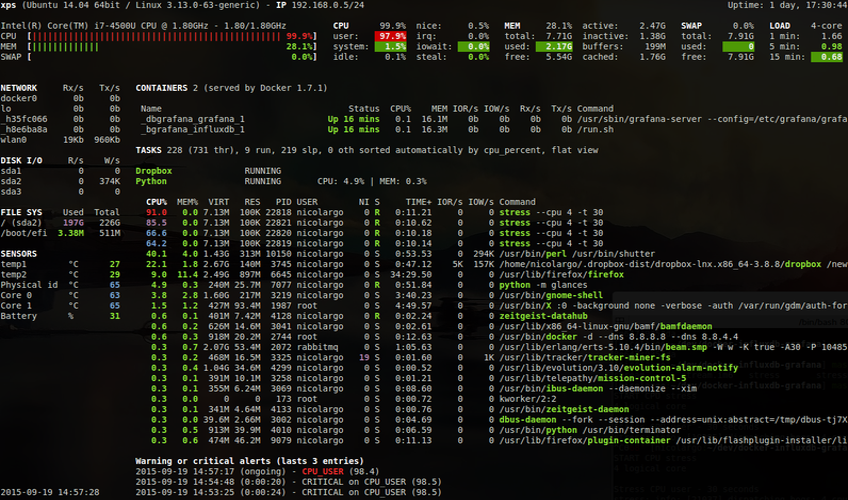
My favorite feature about it is that it sorts the list dynamically in order of importance based on certain metrics. If a process is using an unusually high amount of RAM, it will be at the top. If a process is sucking up a lot of CPU, that will also get sorted up top. It can be viewed through the terminal like htop or through the browser if you have it running as a server
Its basically a little GUI for linux that are CLI systems. I do not use it much but it is a nice snapshot if I do not feel like opening a CMD to check.
EDIT: A cli overview would be something like glances: https://nicolargo.github.io/glances/
I've been using Glances, I really like the minimal text aesthetic. Dead simple to set up. Probably not exactly what your looking for though, not so much a dashboard more of a server monitor, but it can be exported to Grafana.
Glances?
https://nicolargo.github.io/glances/
It can both work in a terminal or export its data to a Web UI if need be. And most current Linux distributions already have it in their repositories, or even ship with it out of the box.
To get health/performance stats, I strongly recommend glances: https://nicolargo.github.io/glances/
As others have said, to do stuff like restart, you could easily set up ssh scripts and whatnot, but as I don't have that set up, I don't really have good examples for that.
Well, it is true that if the code is run in a browser, it may not really matter all that much but there still has to be OS specific codes in it.
Personally, I never have any taskbar or menubar visible, they are always set to autohide so this popunder would not work, it would be visible and I'm always running Glances in a terminal.
If netdata won’t do try Glances. It uses Psutil for gathering stats. Although I’ve never tried it in docker I know there is installation instructions for docker.
Edit: here’s the link
You might want to have a look at Glances. It's not a perfect match for what you want, but it comes pretty close. There's a built-in web server mode, so you can access it from other systems on the network without needing to RDP in. The only downside is that it doesn't collect historical information, though it can export data to something like an InfluxDB/Grafana stack for collection and graphing.
You might be able to do it with Glances (https://nicolargo.github.io/glances/). Haven't used it myself, but it can operate standalone or in a client/server model, and export to a bunch of tools: https://glances.readthedocs.io/en/latest/gw/index.html
Penso anch'io, mi verrebbe da loggare la lista dei processi di sistema con qualche script (o con tool esterni, vedi Glances) sperando di beccare il nome del processo, sempre che il malware non abbia qualche contromisura ulteriore (patch alle librerie di sistema?)
Casomai OP se vedi qualcosa postacelo qui
I've been using glances on my desktop and server to monitor CPU (current/max freq, usage, iowait, etc.), GPU, mem/swap/load, network, disk IO, disk usage, temps, Docker containers, and top.
It appears to be a system monitoring tool.
https://nicolargo.github.io/glances/
Looks like it lets you monitor your server with a web UI if you don't want to use SSH. I guess that's pretty cool.
Another similar is Glances. Which has been around for a while. Also Python. It's in most, if not all distros' repos'.
https://nicolargo.github.io/glances/
https://nicolargo.github.io/glances/public/images/screenshot-wide.png
The media center section is served data using https://nicolargo.github.io/glances/, sonarr, radarr, displayed using bar-card, mini-graph-car, and upcoming-media-card. The tv controls are using the https://github.com/roberodin/ha-samsungtv-custom custom component.
The project sounds interesting... I would just caution you that there's already a tool with some traction called <em>glances</em> that acts as a top replacement.
Actually when I first saw your headline and before I'd read all of it, I kind of expected that's what you linked to -- probably inspired by the discussion in this thread where a couple people mentioned it.
Technically "glance" is different from "glances", but personally I'd still consider it likely to cause confusion and bad form.
You can use btrfs device usage /bucket to check how much data is left on each device.
I usually also use glances to check on disk activity.
I do not think that transfer should be taking that long. Is there any warnings/errors on dmesg?
Oh, you mean on the terminal?? It is called "glances" , a python script.
​
You can get it from here glacnces on github or your os package manager should have .
Hey the easiest method I found (and am using to monitor both a Raspberry Pi and a PC) was to use the Glances integration. All you need to do is install Glances on your second Raspberry Pi.
https://nicolargo.github.io/glances/
Once it’s done installing, in terminal (on that Pi), type the command “glances -w” , which will open Glances in webserver mode. Then proceed to Home Assistant, add integration, search for Glances, and type in the IP of that webserver.
The conky settings out_to_console and out_to_ncurses as well as disabling out_to_x respectively may help.
btw, if you are looking for system monitoring in a terminal, you might also want to check out <code>glances</code>
If the sdcard was corrupted it wouldnt be able to run Linux correctly, no ?
​
I use glances via ssh to monitor my pi :
Not a GUI app, it glances is pretty awesome. It does have an embedded web server you can use to get the info in a browser tab, if you want. I use the terminal application to monitor all of my devices.
I can recommend glances. It tends to have bad perfomance on very old machines but it ships with solid defaults and does well all around. It does requirre a little bit of doc reading to get the hotkeys for common actions but how often do you really need anything more than kill, details and process filtering on a desktop?
Glances has docker plugins so you can see each container, mem usage, cpu usage, etc. It also has a webui that works on mobile too.
Just give the old >pip install glances
and >pip install 'glances[docker]'
there's a ton more plugins too.