
What are
/r/askmath's
favorite Products & Services?
From 3.5 billion Reddit comments
The most popular Products mentioned in /r/askmath:


The most popular Services mentioned in /r/askmath:
Desmos
GeoGebra
Brilliant.org
Omni Calculator
Repl.it
Socratic
Wikiwand
Quora
Mathway
HubPages
Cymath
Mathpix Snip
codepad
Microsoft Math Solver
ShareLaTeX
The most popular Android Apps mentioned in /r/askmath:

The most popular reviews in /r/askmath:
This function does not have an elementary antiderivative. So no finite sum, difference, product, quotient, or composition of polynomials, circular functions and their inverses, hyperbolic functions and their inverses, or exponential functions and their inverses will have a derivative that is the integrand
See
for more examples
The arctangent function does this perfectly. See here. I've also included an extra constant 'c', which scales the graph horizontally so you can stretch it if you want.
Yes, the slope of the tangent is 2x everywhere on the function. But that changes depending on your x-value!
The derivative isn't a number - it's another function. Remember, a function is a rule that "takes in" a number x, and "gives back" a number f(x). The derivative, f', "takes in" a number x, and "gives back" the slope of f's tangent line at that x-value.
https://www.desmos.com/calculator/7gcsbmh3ny
Here's a graph of x^2 and 2x. Notice that the parabola is flat at x=0, so you'd expect the derivative to be 0 there - and it is! Where the parabola goes down, its derivative is negative. Where the parabola goes up, its derivative is positive, and the faster it's going up, the bigger the derivative is.
If you graph your two answers, you will discover that they are the same graph, except their vertical shift is different. This vertical shift is taken into account by the +c, therefore, both answers are correct. Using trig identities, it's probable that you could prove your first answer plus 1/4 is equal to your second answer.
Sometimes, integration rules allow you to have multiple different outcomes, especially with trig. My personal favorite is the anti-derivative of sec(x)^2*tan(x)*dx.
First of all, please do not dismiss your classmates. Did you ask your question in class? Did you peek into each of your classmates' mind? And hey, who knows -- maybe they understood the concept, and you didn't.
A single point doesn't have a well-defined slope. However, one can make sense of the slope of a curve, at a single point.
Did your teacher cover secant lines? You can take any two points on the curve (usually given by a function y=f(x)) and draw a line through them. Boom, a slope: delta y / delta x.
Next, fix one of the points (say, the one on the left), and begin moving the other point. As you move the point (you can even move it on either side of the fixed point), you create different lines, with different slopes. What we are interested in is what happens when the two points are reaaally close to each other.
The following desmos does this well: https://www.desmos.com/calculator/8ubngtz3ei
"f" is the function defining the curve (which you can change to any function you want)
"a" is the x-coordinate of the fixed point.
"h" is the distance between the x-coordinates of the two points; it is negative when the other point is on the left side of the fixed point.
The green curve is the secant line I am talking about. Play with the "h" slider, and you will see that you get different lines (with different slopes).
When h is close to 0 -- that is, when the two points are really close to each other -- the green line is very close to the blue line I had not mentioned before. The blue line is called the tangent line, the line that "best approximates" the curve at x=a.
The slope of this tangent line is what we call the derivative. It is the slope of the curve at the point x=a.
This is a classic Bayes Theorem question.
Let's name the urns: Urn A (Balls 1-10) and Urn B (Balls 1-100). I think you're asking, if you draw a ball with #1 on it, what is the probability that you drew it from Urn A (or Urn B).
So the probability that you drew it from Urn A is: P(A | #1) = P(A and #1) / P(#1) = P(A and #1) / [P(#1 and A) + P(#1 and B)] = (0.5)(1/10)/[0.5(1/10) + 0.5(1/100)] = 10/11 = 0.91.
On the other hand, the probability that you drew it from Urn B is the complement: 1-P(A|#1) = 1-10/11 = 1/11 =0.09.
For your generalization question, the value of k is irrelevant. If you change the problem above to be about drawing the ball with a #2 on it, nothing at all changes. For urns with 1->n and 1->m, just substitute the "10" and "100" in the above calculations with n and m. That is P(A | #1) = (0.5)(1/n)/[0.5(1/n) + 0.5(1/m)] = (1/n)/(1/n + 1/m).
Your integration by parts looks correct, but your final solution isn't, so the mistake must be somewhere when you were solving for I. You didn't provide your working for that, so I can't see exactly where you went wrong, but you should check over your algebra.
In general, to check an integral is correct, you can always differentiate it and see if you end up with the original function. Alternatively, if you have access to graph drawing software (e.g. desmos), you can plot the two functions and see visually if they are the same.
Your calculator must be displaying it wrong, or you've typed in the wrong syntax (maybe what you typed isn't what you meant).
Not only does it display without a hump on this free, online graphing calculator, but you can analyze the function itself to see why you shouldn't have a hump.
Get rid of the -2, since that only shifts the graph down two units. Get rid of the 4x because that only affects the slope of the lines connecting the peaks and troughs of the cosine function. You now only have:
cos(x^(pi/2)) <- This is equivalent to cos(sqrt(x)^(pi))
which might possibly give you a hump.
As x increases, x^(pi/2) also increases, just faster because pi/2 > 1. It's not like x increases and x^(pi/2) increases slower at some point; it's always increasing faster.
Eventually x^(pi/2) increases to 2pi, and all that cos(x^(pi/2)) should have graphed is a sideways squiggle that passes from -1, to 0, to 1, to 0, and back to 0-1, with the squiggle becoming slightly more bunched up near x^(pi/2) = 2pi.
Now the cosine function will repeat, what happened before, but faster so the squiggles become even more bunched up. This repeats, and repeats, and repeats for x^(pi/2) increasing past more and more multiples of 2pi. At no point does the overall function slow down to produce a hump.
If you straighten that curved part that measures 47' into a line, the region would measure about 33100 square feet. A bit more than 3/4 acres.
Here's the GeoGebra file if you want to play with it.
https://socratic.org/questions/what-is-the-limit-of-1-1-x-x-as-x-approaches-infinity-2 Not gonna lie we had it back in high-school nowadays we just use it as a rule in college, I copied past this link, it's a known formula but forgot how to prove it
so, from what you've said it sound like you have 2 mics, and you theoretically know the difference in distance between the sound and the two mics, but I don't think this is enough information. to illustrate this, I've made a little toy: https://www.desmos.com/calculator/bzp0vf0ycl
x1 and y1 are the point where the sound originates x2 and y2 are one mic x3 and y3 are the other
The green line on the graph shows all the points that have the same difference in distance between the two mics, and therefore using the difference between when the sounds hit the different microphones could only point to that line at best.
Ignore everyone saying to use l'Hospital's Rule. L'Hospital's rule needs the derivative of sin(x), and finding the derivative of sin(x) needs you to know the limit (x->0) sin(x) / x
​
It turns out lim (x->0) sin(x) / x = 1. You can see this geometically.
Open this desmos presentation:
https://www.desmos.com/calculator/kc7npyjee0
​
You see a sector of a circle or radius 1 with (small) angle theta, going counterclockwise from the usual x=0 position.
​
The height of the purple vertical line is sin(theta).
The length of the red circular arc is theta (since theta is in radians and the radius is 1)
​
You can drag the point labeled (cos(theta),sin(theta)) and move it around. Notice that when the angle is small, the red arc and the purple line are roughly the same length.
​
So if you do the ratio of their lengths, which is sin(theta)/theta, this ratio approaches 1 as theta goes to 0, since the two lengths become equal as theta goes to 0.
​
Tada, the proof that lim (theta -> 0) sin(theta)/theta = 1 is essentially this picture.
​
For your limit, you have that:
​
lim(x ->0) x/sin(x) = lim (x->0) 1/(sin(x)/x)= 1/(lim (x->0) sin(x)/x)) = 1/1 = 1 using limit laws and the limit above.
It's an entertaining video, but such a totally imprecise and misleading way of explaining it that it honestly becomes unhelpful.
Summability methods for divergent series are such dramatic generalizations of normal additions that they are essentially redefinitions entirely.
So, I wouldn't recommend at all for beginners to watch the Numberphile video; watch the Mathologer video instead or read the Brilliant article.
Yes. The only polytope where all vertices are equally spaced is the simplex:
Well, let's see what we have here. You can immediately see that your answer cannot be correct by using a graphing calculator (personally I prefer Desmos), as the line you came up with intersects the given line. Do you see why this means the lines cannot be parallel?
To begin with, we can rewrite the given line equation as 3x + 2y = 5. Then, what do you get if you solve for y? Can you get it into the form of y = mx + b? Based on this, what must be the line's slope? Once you've found the slope of the given line, what do you know about parallel lines? Specifically, how are the slopes of two parallel lines related? You can find a referesher here, if needed. Finally, plug in the point (3, -5), that is set x = 3 and y = -5, and then solve for b. What do you come up with?
> Is this just a floating point related issue? I.E. is it because I'm doing it on a computer with only so many decimals of precision?
No, it's a real thing. Here's a graph of cube roots:
https://www.desmos.com/calculator/fayluvn8kf
The line gets flatter as x increases. For any graph y=x^(n), the graph will get steeper to the right if n>1, shallower if n<1, and stay the same if x=1.
> Can anyone help me learn more about what is going on here and/or more about the relationship between the set of cube roots and the set of whole numbers?
Not reallt sure how to answer that one.
> Should the difference between the cube roots from one number to the next be predictable? Is there an equation which describes this?
The difference between the cube root of an integer x and the cube root of the next integer is just (x+1)^(1/3) - x^(1/3)
The graph will pass through (2, 0), (3, 0), (–1, 0) no matter what value of a you choose.
The peaks and valleys get stretched farther in the y-direction depending on value of a.
Try graphing the polynomial with a = 1 and with a = 2 and compare how they look.
https://www.desmos.com/calculator/lxqoms2uq9
The reason they say a is any nonzero value is if you choose a = 0, then you just have y = 0, and there are way more than just those 3 specific zeroes. Although they didn't say explicitly, they want the function you write to have exactly those three zeros, no more and no less.
The other commenter's insight suggests that the intersection of the graphs of your original two equations (which are circles not centered at origin) is same as the intersection of these two simpler graphs:
x^2 + y^2 = 15 (circle centered at origin)
8x + 4y = 0 (line through origin)
Here is a sketch superimposing both pairs:
https://www.desmos.com/calculator/yok2euwm9n
You can turn on just red and blue circles, or just green circle and orange line, by toggling the icon at left of each equation in the list.
Touch where any two graphs appear to cross to see decimal approximation of the intersection point.
Edit: To get the exact expression for intersection, express y in terms of x using the linear equation.
8x + 4y = 0
4y = –8x
y = –8x/4
y = –2x
Now write the first equation but use (–2x) instead of y. This is how you will "shake off" the y variable!
x^2 + y^2 = 15
x^2 + (–2x)^2 = 15
Simplify using power rule.
x^2 + (–2)^(2)(x)^2 = 15
x^2 + 4x^2 = 15
Add like terms using distributive property.
5x^2 = 15
Divide both sides by 5.
x^2 = 3
Take square root of both sides.
x = +sqrt(3) or x = –sqrt(3)
The affiliated y value for each x can be found using the y = –2x linear equation.
If x = +sqrt(3), then y = –2 * sqrt(3)
If x = –sqrt(3), then y = –2 * –sqrt(3) = +2 * sqrt(3)
Final answer: The two exact solutions are
(+sqrt(3),–2sqrt(3)) and (–sqrt(3),+2sqrt(3))
This agrees with the rotational symmetry you see in the diagram. The two solutions are equally far from origin and in opposite directions.
If I were to approach this problem, I would use calculus. The equation for the slope of the tangent line to f(x) for any given x-value is
mf = 8x + 5
You Google the term "Derivative" if you want to figure out how I got this. For any given x-value, say x=a, the equation of the tangent line to f(x) would be given as
y - f(a) = mf(x-a)
or plugging in f(a) = 4a^(2)+5a+3 and mf=8a+5,
y - (4a^(2)+5a+3) = (8a+5)(x-a)
or
y = (8a+5)x - 4a^(2)+3
The equation for the slope of the tangent line to g(x) for any given x-value is
mg = 4x+3
Using the same process above, the equation of the tangent line to g(x) at some spot x=b is
y - (2b^(2)+3b+4) = (4b+3)(x-b)
or
y = (4b+3)x -2b^(2)+4
The condition that two lines are the same are that the slopes have to be equal and the intercepts have to be equal. Therefore,
8a+5 = 4b+3 and -4a^(2)+3 = -2b^(2)+4
If you solve the systems of equations, you get a few answers:
a = (-2 - sqrt(6))/4
b = (-1 - sqrt(6))/2
and
a = (-2 + sqrt(6))/4
b = (-1 +2 sqrt(6))/2
Let's use the first pair of answers. If we plug in a = (-2 - sqrt(6))/4 into the equation of the tangent line that I had way above, we get
y = (1-2sqrt(6))x +(1/2)-sqrt(6)
So this is one answer. The other answer comes from the second 'a' we solved for in the system of equations. If I plug that 'a' into the equation of the tangent line and simplify we get
y = (1+2sqrt(6))x +(1/2)+sqrt(6)
Here's a graph of what the tangent lines look like.
To be honest, I'm not sure what you actually did in your post. Hopefully, I didn't make any mistakes in coming to the two answers above (the algebra was tedious) but they are not trivial to find.
The vertical asymptote is found when the denominator is set equal zero and solved for x. The horizontal asymptote is found when you take the limit as x approaches infinity. A graph is also nice to have to visually find the asymptotes.
n = {1,2,3,4,5,6,7,8,9,10}
n is the strip you want the area of. So n = 1 means you want the area of the first 10%.
d = 35 mm
r = 17,5 mm
s = nd/10 or s = nr/5
The area of a wedge is:
A = θr^(2)/2
θ = 2arccos(1 - s/r)
so
A_w = arccos(1 - n/5)r^(2)
The area of a triangle is:
A = rcos(ϕ)/2 * rsin(ϕ) * 2
ϕ = θ/2
so
A = r^(2)cos(ϕ)sin(ϕ)
A = r^(2)(1 - n/5)sqrt(1 - [1 - n/5]^(2))
A_t = r^(2)(1 - n/5)sqrt(2n/5 - n^(2)/25)
Now to get the strip area:
A_s = (A_w2 - A_t2) - (A_w1 - A_t1)
Meaning that you get the area of the strips to the left of the strip you want the area of, and subtract that from the area of the strips including the one you want.
A_s = r^(2)[ arccos(1 - n/5) - (1 - n/5)sqrt(2n/5 - n^(2)/25) - arccos(1 - [n - 1]/5) + (1 - [n - 1]/5)sqrt(2[n - 1]/5 - [n - 1]^(2)/25) ]
LaTex Version:
[;{ A }_{ S }={ r }^{ 2 }\left[ \arccos { \left( 1-\frac { n }{ 5 } \right) } -\arccos { \left( 1-\frac { n-1 }{ 5 } \right) } -\left( 1-\frac { n }{ 5 } \right) \sqrt { \frac { 2n }{ 5 } -\frac { { n }^{ 2 } }{ 25 } } +\left( 1-\frac { n-1 }{ 5 } \right) \sqrt { \frac { 2\left( n-1 \right) }{ 5 } -\frac { { \left( n-1 \right) }^{ 2 } }{ 25 } } \right] ;]
It's "easy" to set up, but comes out rather ugly.
Edit: Fixed the equation. Signs were flipped in the previous equation. Here I have a calculator check my work.
Based on this (the best info I could find in 2 minutes of searching), and taking the volume of the ocean to be roughly 4.4x10^22 fluid ounces, and assuming that's it's fresh water:
Anywhere from 3.3x10^18 to 1.67x10^19 miles, or 57000-285000 lightyears depending on the brand.
To put that another way, using a decently absorbent brand you would need enough to start at the sun and wrap around the galaxy once. A crappy brand and you need to wrap around the galaxy about 3 times. That's right. The galaxy.
/u/sonstiges gave you the math, but I also updated the tool to include that change.
It now has 5 sliders, to control the starting point and the destination. You can also just type in values if you click the numbers, if you want more specific values.
Edit: Didn't even know this was a thing, but apparently you can also just drag around the starting and ending points in the graph itself, so there's no real need to use the sliders.
I did the math in a slightly different way, using the coordinates instead of the angle. But both are valid, and depending on what you're given, one or the other could be easier.
Thanks for the gold, dude!
Decided to make this quick little tool for you, as a thanks. It has a slider top left to change how many warps, and the position should update on the graph and show the coordinates after that many warps.
Tc;dr ~21.5 feet
Use Pythagorean theorem to find diagonal distance across floor: ~15.6'
Assume parabolic shape of tent poles (because I'm lazy and can't find any information on the shape of a flexible rod under axial compression: y=-x^2 /10.2+6
Consider the arc length formula s= S [a/b] sqrt(1+(dy/dx)^2 )dx, which is a hell of a lot easier to look up than derive mathematically. dy/dx is the derivative of our function, which happens to be -x/5.1. Substituting gives us S [-7.8/7.8] sqrt(1+(-x/5.1)^2 )dx.
Because the function is symmetric around the x-axis we only have to integrate half the domain, so from 0-7.8 then double the result. Punching that into my Magic Math Box (because integrals of square root functions are a bitch[even if they are sum of two squares]) gives us a half-length of 10.75. Doubling that is 21.5.
Reality check: We should expect the length to be over the distance of a straight line going from the ground to the apex of the tent and back to the ground. Pythagoras says this is approximately 19.7 feet, which is close enough for comfort.
If you draw a circle centered at W with radius 5.6m you'll find the line extending from VU will also intersect the circle at another point, call it U'. WU' is thus also 5.6m (since it is also a radius of the circle) and you have another triangle that meets the criteria in your picture. The angle WU'V is 43.69 but the question is about the triangle with the obtuse angle.
Say you want an arc that is defined by a cord of length d and height h. Without even needing to solve for the radius, you know that the angle formed by one end of the chord, where the arc peaks, and the other end of the cord is going to be constant at all points on the arc. Here's a visual to convince yourself.
Take a straight edge (preferably one that exceeds the chord length) and fix one end of it at one end of the chord, pointing the other end at the peak. Measure and maintain the aforementioned constant angle as you increase the angle made by the chord and straightedge, marking the position at which the constant angle exists between your measuring device and the ends of the chord, as you slide your measurement device down the straight edge to the end at the chord.
The marked positions will trace out your arc, at least in theory. I'm not 100% sure of how well this would work practically but then again if you need to use this method practicality has already left the building. Feel free to ask for clarification.
Glad to see u understood coz its my 1st answer on this subreddit , im 15 in highschool so most stuff here is higher level . .
Nice to see that you wanted to make sure u were right b4 teaching ur niece..
As for the fraction method , need to know ur tables mate , its pretty ez , im currently learning the table of 13 and 14.......
Here are some apps for learning tables easily, even ur niece can try it :
https://play.google.com/store/apps/details?id=com.snowball.timestables
https://play.google.com/store/apps/details?id=com.cuelearn.cuemathapp
Hope it helps :)
Lol that’s like half of a multivariable calculus course. Would strongly suggest watching videos on Khan Academy or picking up a textbook. These aren’t things that can easily be explained over Reddit.
https://www.khanacademy.org/math/multivariable-calculus
There are some good textbooks too. Would recommend Multivariable Calculus - Late Transcendentals by Jon Rogawski.
Calculus: Late Transcendentals Multivariable https://www.amazon.com/dp/1319055788/ref=cm_sw_r_cp_api_glt_fabc_GPW2AAHRRNHD2QZYQJ5F
I googled the brand name and found this:
https://www.amazon.com/Bestway-54066E-Elliptic-Play-Multicolor/dp/B07G531B1Z
The reason I googled it is that the given dimensions show the outer ring, but the the volume of the inside of the pool are different and depend on the size and shape of the walls, which isn't shown.
The link says 542 liters.
The balls fill the space imperfectly with some air between them. This is called the "Sphere packing volume", which is the percentage of a given volume the spheres contain on average. https://www.euro-matic.co.uk/ball-calculator/ Ignore the calculator, here's the part that matters:
> Carl Friedrich Gauss proved in 1831 that Hexagonal packing is the densest possible amongst all possible lattice packings using the following formula: Density=π/(3√2)=74.048% Whilst the best possible packing density is about 74%, the theoretical worst is about 60% before you stop actually filling the space or start ignoring gravity, and randomly-poured sphere packing efficiency is around 64% which is traditionally used for playpen balls.
So, lets do what they say and assume that the balls need to occupy 64% of the volume of the space on average. 64% of 542 liters is 346.88 liters
Each ball is 6.5 cm in diameter. The volume of a sphere is v=4 pi r^3 / 3=4 pi (d/2)^3 / 3 = 4 pi d / (8(3)) = pi d^3 / 6
for 6.5 cm, that's v=pi (6.5)^3 / 6 = 143.793313749 cubic cm per ball.
One liter = 1000 cubic cm. 347 liters = 347000 cubic cm worth of balls
347000 cubic cm per pool / 143.79 cubic cm per ball = 2413.24 balls.
Rounding up to nearest hundred is 2500 balls = 25 packs = $250
I would always suggest sketching these types of problems, I find it helps me make sure I've understood what is being asked.
- As u/MegMewtwoZ pointed out, the angle PRQ is a right angle. (Thales' theorem if you want to google it) So you can use Pythagoras theorem A^(2) + B^(2) = C^(2) , therefore PR^(2) + QR^(2) = PQ^(2) , which is (C)
​
- starting where i left off:
BE^(2) = AB^(2) - AB^(2)/4
BE^(2) = 3/4 AB^(2)
4BE^(2) = 3AB^(2)
AB = BC = CA, so AB^(2) + BC^(2) + CA^(2) = 3AB^(2)
so the answer is (C) AB^(2) + BC^(2) + CA^(2) = 4BE^(2)
Thank you so much for the reply.
I was hoping for a widely accepted practice, and not something specific to khanacademy.org.
>You'd be within your rights to complain if they deducted points for that|
Not so much points deducted, but progress hindered as I cannot move on to the next unit of instruction until I have answered ten in a row correctly.
Again, thank you for your generosity. You didn't have to take the time to answer my question. I do appreciate the reply.
If you are asking whether 2^x = 3x is a valid equation, then it's true for two values but they aren't integers and aren't exact.
This can easily be confirmed by putting y = 2^x and y = 3x into a graphing calculator such as Desmos and seeing two intersections.
Have you done anything about the Lambert W function? It is defined as the solution to the equation y = (x) * e^x and helps you to work this particular problem out.
Yeah, so for part a it will be opposite. You're right in that they do increase on different parts of the graph, so they want you to tell them where exactly it's increasing and where it isn't. For our mother function, f(x), it's increasing for (-infinity, -1)U(2, infinity), and decreasing for (-1, 2). The U symbol is a fancy way of notating that it's for both intervals, and they'll probably want you to use that.
In Part A, we're told to find the intervals for increasing and decreasing for f(-x), which as you've said, is the opposite of f(x).
What we'll get is that it will increase for (-2, 1) and decrease for (-infinity, -2)U(1, infinity).
I think what might be helpful if you see what these graphs and their transformations look like. I'd recommend going to Desmos, typing in f(x)=x^3, or some other function, and in another row typing af(b(x-c))+d. You'll get a bunch of sliders for a, b, c, and d, and you can see what each component does to the graph. If you really want a good grasp on how function transformations work, try playing around with this, and think about why each part does what it does.
Here's a graph I made that might make the problem clearer:
https://www.desmos.com/calculator/xfoodd08zz
It can be simplified (in terms of computation) if p is a whole number. Ideally there would be a way to make a smooth graph where p=1.5 without getting to wobbly anti-aliased artefacts from adding up the cosine waves...
Any help much appreciated ^_^
Here's a visual proof of the result. An "algebraic" expression is given on the page I stole that image from: here.
First, I'm redefining variables:
N (for iNner) is the inner radius of the torus, and the radius of the sphere
r is the minor radius of the torus
The major radius of the torus is then N+r
Equating volumes gives
(4/3)π N³ = (πr²)(2π(N+r)) (2/3) N³ = (πr²)(N+r) (2/(3π))N³ = Nr² + r³ r³ + Nr² - CN³ = 0 where C is the constant 2/(3π). You now have a cubic equation, which should make you blanche in terror, especially since the coefficients are not particularly cooperative when it comes to easy calculation. I'd recommend graphing and settling for an approximate solution, like so. And hey look, a nice easy linear graph! Which isn't all that surprising, really, if you think about it. Of course, Wolfram Alpha shows how the sausage is made, and it's not ENTIRELY linear, but it's pretty close.
Desmos appears to suggest that 8 is correct.
Maybe it would help if you shared some of your reasoning that led you to think that 0 is correct, and we could point out the error?
in addition to the other comment, if the graph did have a region where the oscillations slowed down, this would be at the stationary points of the function inside the cosine(the "phase"). This observation forms the basis of the method of stationary phase https://en.wikipedia.org/wiki/Stationary_phase_approximation
Here is a graph of sin(T f(x)) where f(x) has many stationary points, and T is varying. You can see the persistence of "large graphs" even for large T, around the stationary points of f.
As wij said, there are definitely instances where odd numbered cents don’t require 100 gallons. That’s just the upper bound. Looking at a decimal (to the hundredths place) mod 1 is proportionally the same as looking at a 2 digit whole number mod 100. Of course, mod 100 of any whole number multiplied by 100 will be 0.
PBut there are odd numbers that have a multiple less than 100 where mod 100 of that number is 0. Mod 100 of (25 * 4) is 0, so $0.25/gal only needs 4 gallons to get a whole number price. Mod 100 of (35 * 20) is 0, so $0.35/gal needs 20 gallons to get a whole number price.
I made a quick and dirty program to calculate all possible values - if it takes 100 gallons, it doesn’t include that row, so it only shows the values that happen when it takes less than 100 gallons to reach a whole number.
https://codesandbox.io/s/loving-ellis-4ip19?file=/src/index.js
Yes, here is the same problem (Problem 4), simplified. If by purpose you meant application, I have actually used the formula for the area (and volume, in 3D) myself, studying arrangements of hard spheres, a quite active research topic.
I can't see too closely at the dimensions, but it looks like half of the hat is 4", so the radius is 4".
Circumference = 2*pi*r = 25.13"
Now you have to get a circle of that size and see if it fits on the kids head, and if it is angled, that is how the hat will sit.
First things first, we know that there need to be a positive, integer number of bags of food X and Y. Negative food doesn't make sense.
The total amount of nutrient A must be at least 14, and we know that every bag of food X has 2 units of A, and every bag of Y has 1 unit of A. From this we can write the formula 2x+y>=14.
Similarly, we can find a formula for the total amounts of nutrients B and C. Therefore:
> 2x+y>=14
> x+y>=12
> x+3y>=18
We also have another formula which constrains the problem: the total cost of the food. Cost C = $2x + $4y. We want to minimize Cost C, while making sure to keep all three of the above formulas satisfied.
I graphed out this problem online for clarity: https://www.desmos.com/calculator/xtwvrgrjqf
The three nutrition inequalities must be respected, so the point on the graph which represents the number of bags of x and y food must be above all of those first three lines plotted on Desmos. From looking at the graph, the system of equations can now be simplified to three ranges:
> 0<x<=2 : 2x+y=14 is the limiting equation
> 2<x<=9 : x+y=12 is the limiting equation
> 9<x<=18 : x+3y =18 is the limiting equation
This still leaves us a massive range of possibilities that would keep the ferrets healthy, but we also need to consider that fourth equation of the Cost. For explanatory purposes I picked a random cost of 2x+4y=$10 to plot. You can see that by editing the formula to increase the cost from 10 to 30, the cost line will intersect the bottom of the area above the other three lines that will keep the ferret healthy. This is the lowest possible cost to keep the ferret fed. This also happens to give us an answer that gives an integer number for number of food bags: x=9, y=5.
If you allow negative answers, there are actually 4 roots (I'm using desmos, which plots for negative y also)
So we want to define the domain so that the function can have an inverse. And since it's x ≥ a, we know that arbitrarily large positive values of x will need to be included in the domain, and we are allowed to exclude arbitrarily large negative values.
If you graph the function g(x) you'll get a sort of sideways and elongated S shape. The point at which the function can no longer be given an inverse function is the point where a tangent to the function is horizontal and the concavity is non-zero (concavity is negative if the function looks like a upside-down U shape around that point and positive if it looks like an upright U shape).
If you know what a derivative is you can take the derivative of g(x) and set it equal to 0, then solve for x and check how the function looks around that point to be sure it's non-negative:
g'(x) = 3(5 - x^(2))/(5 + x^(2))^(2)
g'(x) = 0
3(5 - x^(2)) = 0
5 = x^(2)
x = ±√(5)
And if you check around both values you'll see the concavity is definitely non-zero. But we can only use one. We're going to have to use the positive value rather than the negative one, because it is the first instance approaching these critical values from the right at which our conditions hold.
Thus, a = √(5) allows for g to have an inverse.
Imagine a triangle that extends from the center of the polygon to one of its sides. It will have an area of:
1/n = (1/2)bh, where b is the length of the side.
We need to figure out what h is in terms of n.
A line segment perpendicular to and touching the side and connected to the center of the polygon will have the length h. The angle formed between one of the longer arms and this perpendicular segment will be pi/n radians or 180/n degrees. We want the side length adjacent to the angle, and have the side length opposite it. Since cot(θ) = a/o, we can find the height in this way:
cot(pi/n) = h/(b/2)
h = b * cot(pi/n)/2
Plugging this in we see our relation between the side length and n is:
1/n = (1/4)b^(2)cot(pi/n)
And solving for b we find:
4tan(pi/n)/n = b^(2)
b = 2sqrt[ tan(pi/n)/n ]
Check out this desmos demonstration. Click on the triangle next to slider t.
https://www.desmos.com/calculator/rqk2dvvh6j
One parameterization governs the black dots on the circles. The open black dot is the point equidistant from the black dots at every point in time. In that parameterization, the open black dot is tracing out a semicircle.
The orange dots represent another parameterization, where they move in opposite directions along the circles. The open orange dot is equidistant from the orange dots at every time. This describes part of an ellipse in this particular setting.
I think maybe it's the open orange dot pathway that you're thinking about getting.
So the idea is that you need to make a choice about what points you're thinking of connecting between the two arcs.
In the demo here, the two arcs covered by dots on circles are both half circles but have different circumferences. If you had circular arcs with different radiuses and they weren't both same central angle, then you'd probably want to arrange things so point starts at one end and ends at other end of the arc at the same time, which would require adjusting the parametric equation so that start and stop points would be correct.
I think that's what Godivine is suggesting.
Here's graph for some values of A = 3, 2, 1, 1/2, 1/3.
https://www.desmos.com/calculator/n7sbaalr2l
You can see graphs are symmetric so that graph when A = 3 has same difference between local extrema as when A = 1/3.
Also note that for values of A that are negative there's a matching graph: A = -2 matches A = 1/2. You can show this algebraically.
Inspecting the graph you can see that when A = 1 you have the smallest difference between local minimum and local maximum.
Toggle the icons to left of each equation to turn them on and off, to help you see just the ones you want to see.
So the answer to the question is: A = 1 or A = –1.
That's not a proof but gives you insight into the direction.
Here is a graph of (1 + x)^(1/2) as an example.
https://www.desmos.com/calculator/bwlgbkochs
I've graphed four different "approximations" that are simply what you'd get if you take first term, first two terms, first three terms, first four terms of the expansion.
Try turning those on one by one (you can toggle the icon to the left of each equation to turn off and on).
You'll see at least in the region around x = 0, the functions with more terms seem to behave very much like the original red function.
The approximation is only good around x = 0, as you can see these polynomial graphs do not "hug" the curve for very long. But for convergent series, the more terms you add, the better the approximation is and the "wider" the interval of good match.
In a sense you could think of the infinite series polynomial as the "limit" of this process of "hugging" the original red square root curve.
As you can imagine, being able to give a "power series" expression to a function means you have an algorithm for thinking about a sequence of better and better approximations that can be done with finite number of operations. You can see how this would be potentially useful as a method for numerical approximation. (For example, there is a power series representation for cos x that can give you more accuracy the more terms you add.)
I'm extrelemly drunk rn so grain of salt but my rough calculations tell em that the length of each arc is as follows
| shape | length | area |
|---|---|---|
| circle | 50.7067 | 6084.804 |
| parabola | 50.3686 | 6044.232 |
| catenary | 51.6443 | 6197.316 |
As al;ways most of my work can be seen here
Reply if you need clarfification, preferably tomorrow when I sober up a buit
Every expression of the form a cos x + b sin x can be written as c cos(x - p) where c^2 = a^2 + b^2 .
Try playing with the sliders here and figuring out what is happening: https://www.desmos.com/calculator/jcs9xtmsqx
This is a visual of what's going on. Both angles fit the bill, because the sine of both is -.24. To get the other angle, given 346.1 deg, you need to subtract it from 360 deg to get the acute angle left under the x-axis, then add that to 180 deg. Make sense?
"Instantaneous rate of change" is a figure of speech and an oxymoron. I say if you find the phrase confusing just forget about it.
The derivative can be defined as a limit. Limits are easy to define in formal mathematical language ("for all epsilon greater than 0 there exists a delta greater than 0 such that...") but notoriously difficult to define in plain English. Your best bet might be to just hunker down and learn the epsilon-delta definition. Mathematicians didn't get this concept right until about 200 years after the invention of calculus so it's understandable if you find any of this tricky.
You mean like this?
https://www.geogebra.org/m/wadr5rx2
Then you can solve it with trigonometry: tan(angle) = opposite/adjacent. You're searching for the length opposite of the angle, which gives you opposite = adjacent·tan(angle).
It depends what you are asking.
There are three games you are talking about here:
Game 1: One coin flip, only. This has a 50/50 chance of winning
Game 2: You pre-declare a best of 3. This also has a 50/50 chance of winning (possible rolls: 00 (loss),11 (win), 10X (50/50), 01X(50/50))
Game 3: You don't pre-declare best of 3. You ask for, and then recieve, a best of 3 game but only if you lose the first one.
This game actually gives you an advantage. Possible rolls:
1 (win) 50% 0 (50%) ->0 (lose) 50*50=25% ->1 25% ->0 (lose) 50*50*50=12.5% ->1 (win) =12.5%
You only lose 37.5% of the time with this game so waiting to ask until after you lose gives you an advantage.Here's a simulation
Lets make some assumptions. Lets assume that both 7-digit phone numbers and SSN numbers are uniform-random numbers (which is probably not true in practice)
Lets first look at the probability that you and him both have the last 6 digits exactly the same.. Given your phone number, the probability that he has the same number is 1/1000000.
However, given that you have maybe, 100 friends whose numbers are in your phone, the probability that you and at least one of your friends has the same number is 1-P(all of your friends have different numbers than you), which is 1-(999999/1000000)^100 = 0.00009999505 which is about 1/10000 (so much more likely).
The probability that you and him both have the last 6 digits the same and his 3 digits subtracted=your 7th digit is equal to a*1/1000000, where a is the probability that his 3 digits when subtracted result in yours. For 3, there are 28 ways to do that, so a=28/1000 and the probability is 28/1000000000.
The probability that it is true for one of your friends (not him specifically) is 1-(99999999972/1000000000)^100m which is approximately 1/35000
Wow thanks for attempting! What I thought of was to set the right side = c (a constant) and by doing so I was sure I could find something online: https://socratic.org/questions/59e5f259b72cff6c4402a6a5 that ended up helping me out and I got an eqn that worked!
I think I get it know, this should give what you want. There's a label with the coordinate (d,Hb) to a few decimal points, you can scroll down on the left for more decimals.
Unfortunately it now only works when slope A goes up and slope B goes down, although I can probably expand it to work in other situations too if you'd like.
I made this for you, it graphs a smooth arc between two slopes. There's 5 sliders at the top left you can play around with, the arc updates with those.
It should always connect with the correct height and slope, but let me know if it's not quite what you're looking for.
Scroll down on the left to find the formulas used, i can clarify if necessary.
The forward, or y directional velocity is equal to [;v\cos { \left( \theta t \right) };], so the y position of the wheel's center if starting at the origin will be the integral from 0 to some desired time of that, or [;\frac { v\sin { \left( \theta t \right) } }{ \theta };], where t is the time (only variable) in both equations.
The horizontal, or x directional velocity is equal to [;v\sin { \left( \theta t \right) };], so the y position of the wheel's center if starting at the origin will be the integral from 0 to some desired time of that, or [;\frac { -v( 1 - \cos { \left( \theta t \right) }) }{ \theta };], where t is the time (only variable) in both equations.
So the point being traced would at any time t be:
[;\left( \frac { -v\left( 1-\cos { \left( \theta t \right) } \right) }{ \theta } ,\frac { v\sin { \left( \theta t \right) } }{ \theta } \right) ;]
Here's a visual of it. It traces a circle, which should be of no surprise, but with the addition that the point is constrained to the values of v and [;\theta;].
Is this what you were hoping for?
Okay, well I have an idea for a formula then, and here's how I came up with it:
f(1) = 1 of course.
f(2) = 1/2 + 1/2 which is a special case.
f(3) = 6/9 + 2/9 + 1/9
f(4) = 48/64 + 12/64 + 3/64 + 1/64
f(5) = 500/625 + 100/625 + 20/625 + 4/625 + 1/625
...
f(x) = [ 1 + (x - 1) + sum{n = 3 to x}( (x - 1)(x)^(x - n + 1) )]/[ x^(x - 1) ]
Nicer looking version without s****y Reddit format constrictions here.
This formula more-so puts 1 (100%) into a format which you can simplify into x number of fractions (percentages) which all decrease over their span.
Personally though I like /u/HorribleUsername 's formula better as it doesn't produce super small percentages like mine (and is easier on the eyes in Reddit format).
Edit:
Method discovered with f(3) and f(4):
f(3) = 1 = 2/3 + 1/3 = 2/3 + 2/9 + 1/9 = 6/9 + 2/9 + 1/9
f(4) = 1 = 3/4 + 1/4 = 3/4 + 3/16 + 1/16 = 3/4 + 3/16 + 3/64 + 1/64 = 48/64 + 12/64 + 3/64 + 1/64
From there the same pattern follows.
The reason I call f(2) a special case is because although it follows this pattern it does not fit into the category of decreasing order.
It sounds like what you're looking for is a piecewise function that is f(x)=sin(x⋅pi/2) for 0≤x≤4 and 0 elsewhere. In other words, one cycle of a sine wave of frequency pi/2. What this looks like: https://www.desmos.com/calculator/qvm5pxhfnn
There are other ways to express this, such as the product of the sine function and an indicator function (aka characteristic function, boxcar function of magnitude 1) that is 1 on the interval [0,4] and 0 elsewhere, but the result is the same.
This will probably help.
This interactive webapp traces the unique parabola that is defined by three points. You can drag the points around and itll trace out the unique parabola right on the screen.
What is the longest line that can fit in a rectangle?
For the equation: https://brilliant.org/wiki/3d-coordinate-geometry-equation-of-a-line/
> You bet $1 1024 times to flip heads 10 times in a row.
P(10 heads in a row) = 1/1024. Your expected winnings are (1)(1/1024) + (-1)(1023/1024) = -1022/1024 per flip. By linearity of expectation, you will expect to lose (-1022/1024)1024 = -1022 dollars.
> You bet $1024 to flip heads once.
P(1 head) = 1/2. Your expected winnings are (1024)(1/2) + (-1024)(1/2) = 0. Your expected winnings are not equal.
This is a straight-up case of linearity of expectation: In scenario 1 the expected damage is 1/3 per die, so 2*1/3 = 2/3 per turn. In scenario 2 the expected damage is 1/6 per die, so 4*1/6 = 2/3 per turn. What is different about the scenarios, as others have pointed out, is the distribution of damage (e.g. in Scenario 2 it is possible to receive 3 or 4 points of damage)
Take a look here and fiddle with the two sliders for a few minutes:
https://www.geogebra.org/calculator/swu5fvhx
See how cosine and sine can take negative values for certain angles? Triangles don't have negative lengths, but vectors could point into directions with negative coordinates.
It sounds like you are talking about a paraboloid surface.
This link will give some insight into finding the area within the 10 x 10 square you want.
So you have an equation for the paraboloid surface z = x^(2)/a^(2) + y^(2)/b^(2) + c, and you have the limits of -5 <= x <= 5, and -5 <= y <= 5
You said you want the curve to be at 2 ft high in the center of the walls. This means the new surface will be higher at the corners.
Or you can have the height be 2 ft at the corners, but it will be lower at the centers.
Option 1:
The surface passes through (0,0,-2), (-5,0,0), (5,0,0), (0,-5,0), and (0,5,0)
-2 = 0/a^(2) + 0/b^(2) + c
c = -2
0 = 25/a^(2) + 0/b^(2) - 2
25/a^(2) = 2
a^(2) = b^(2) = 25/2 = 12.5
So the surface is given by z = x^(2)/12.5 + y^(2)/12.5 - 2
At the corners, z = 5^(2)/12.5 + 5^(2)/12.5 - 2 = 2 + 2 - 2 = 2
So the new surface is at its lowest in the center, at -2, then in the middle of each wall, it's at 0, and the corners rise up to 2
The area is the double integral between -5 and 5 of the square root of (1 + (dz/dx)^(2) + (dz/dy)^(2))
The solution is 118.9 ft^(2)
Option 2:
The surface passes through (0,0,-2), (-5,-5,0), (5,5,0), (5,-5,0), and (-5,5,0)
-2 = 0/a^(2) + 0/b^(2) + c
c = -2
0 = 25/a^(2) + 25/b^(2) - 2
25/a^(2) +25/b^(2) = 2
1/a^(2) + 1/b^(2) = 2/25
The surface is symmetrical, so a = b
2/a^(2) = 2/25
a^(2) = 25
So the surface is given by z = x^(2)/25 + y^(2)/25 - 2
This surface has the center at -2, the corners at 0, and the middle of each wall will be;
z = 25/25 + 0 - 2 = -1
The area is the double integral between -5 and 5 of the square root of (1 + (dz/dx)^(2) + (dz/dy)^(2))
The solution is 105.1 ft^(2)
Not sure if there's a way to solve it using just math, but I came up with 45 possible combinations using Python:
Click "Run" to get a list of all of them.
This is assuming it could contain 100s, 50s, 20s, 10s, and 1s.
Ok. That was adequate proof. Here's a hint along with a solution.
Hint: >!There are 3 pairs of tangent line segments. What property do these pairs have?!<
Solution: >!Using the property that tangents drawn to a circle have the same length, we see that QX=QA, RA=RY, and as you already mentioned, PY=PX=12. We want to compute the perimeter, p, of PRQ. By the definition of perimeter, that is p=PR+PQ+RQ. We can then break that down into p=PR+PQ+(AR+AQ). Using the identities we mentioned earlier, we can then rewrite this as p=PR+PQ+RY+QX. Rearranging, we get p=PR+RY+PQ+QX. Geometrically, we see this is the same as p=PY+PX. Of course, we know these lengths, so we have p=12+12=24.!<
Six is really young! I was a math prodigy and doing algebra at age 6, but I don't recall thinking about infinity until much older.
I'm trying to remember what mathy things I liked at age 6, but I may have to move it to age 8 through 10 :). OK, I loved magic tricks. Here's a Martin Gardner book with math-related magic tricks: Mental Magic: Surefire Tricks to Amaze Your Friends.
For some woah-dude stuff with lots of pictures (this is what I liked), there's The Colossal Book of Mathematics: Classic Puzzles, Paradoxes, and Problems. I also loved mathy puzzles.
That's one's also by Martin Gardner. He has dozens of other books and I'll bet money that at least one will be right up your son's alley.
My parents bought me all kinds of cheap Dover reprints of classic math and science and everything else books when I was a kid, including lots of puzzle and game type books. I guess recommending books is a little old-fashioned, and it felt old-fashioned even to me as a kid to be reading all these books from the 1920's, but I guess it worked...
Found this as the first result when searching 'graphical calculator' on the play store. Need to pay premium for a longer history but it's only £2. No idea if it's the best, just the first one I found.
Also, for a more thorough introduction to mathematical logic, there are many books available. For example, a good one that is conveniently available as an affordable paperback is Kleene's Mathematical Logic.
I went looking for the book you recommended, as I will be doing a lot of statistics as a research student starting this fall. I found How to Lie With Statistics by Darrell Huff and Statistics Done Wrong by Alex Reinhardt.
Could you clarify which one you're referring to? I would be interested in reading a copy while we're still in the summer months.
Here check this book out: A First Course in Mathematical Modeling (Giordano et al 2013): https://www.amazon.com/First-Course-Mathematical-Modeling/dp/1285050908
imo the best way is to find problems that interest you and practice more!
you have 3 unknown angles: PRQ, OPQ and PQO. however, OP = OQ because O is the center of the circle. so the triangle POQ is isosceles and angle OPQ = angle PQO. so you have two unknows. do you have two equations? yes, you know that the sum of the angles of triangle PQR is 180, and the same applies to triangle PQO.
You can find out the distance PRQ and the slope of that path exactly. For the time, you only have to estimate it, so you can make a guess at how fast a fit 75 year old can walk up that slope.
For reference, an average 75-year old walks at about 4km/hour on the flat (found from Google).
i know that triangle PRQ = triangle XWY because angle Y = angle W and angle P = angle Q by alternative exterior angle theorem and angle Y = angle R and angle SQW = angle X by corresponding angles postulate. therefore PQ being 6 since yknow YX is 6. ( Given ) But i dont understand how to calcuate the SY and PY? any hints?
First, see if you can establish a relationship between angles BPQ and PQD using the Z theorem (or whatever name you may know it by) so that you can represent them both with a single variable. Because these angles are both bisected, by the lines PR and QR respectfully, you can also deduce that angle RPQ is half of BPQ, and similarly angle PQR is half of PQD. These are two of the angles of triangle PQR, and the goal angle PRQ is the third, so using what you know about triangle angles should bring it home.
This is middle school math, in an isosceles triangle the altitude and the median are the same so both angle PRS and angle PRQ are the same and QR and RS equal because a median cuts the side it connects with to half and finally both triangles share PR so you can do SAS (sorry if my mathematical terms were weird I learned math in a different language and pulled the terms from google)
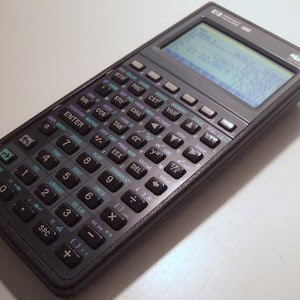
My first thought is Droid48, but that really is only a good idea if you already understand HP syntax (Reverse Polish Notation).
I am sure there are similar Android emulators of TIs and others, but I've not had occasion to use them.
Whatever app you use, #3 will work for simple-ish problems, but not be up to Wolfram Alpha level of sophistication.
I guess I would say preferably both, depending on the wall mount. The extension is not completely rigid and straight, as it has a joint halfway along its shaft; and the TV at the very end can also swivel at different angles.
It's difficult for me to elaborate into words exactly what I'm trying to convey. Let me provide you with some links to products on Amazon along the lines of what I'm looking for...
https://www.amazon.com/Articulating-Adjustable-Extension-400x400mm-Pipishell/dp/B08B4SLC9K
The solution is sqrt(3) and -sqrt(3).
https://www.desmos.com/calculator/cj9hmc3a1v
I graphed the one on the left quadrant. Here's how we know:
The tangent line intersects the radius at a right angle. That is part of the definition of a tangent line.
So in the graph, there is a large right triangle formed with the green line and the blue line (which are perpendicular). The green radius must be 5, right? Because the circle equation shows a radius of 5. And we also have a leg with a length of 10 (vertical, to the y-intercept). This follows the proportions of a special 30-60-90 triangle. The tangent line forms a 30 degree angle with the y-axis (or, a 60 degree angle with the x-axis).
From there, you might need basic trigonometry to show that the slope = tan(60) = sqrt(3).
I've plotted the circles along the x-axis, to make things a bit easier.
Finding the areas is then a case of taking integrals of the equations for the curves, and since the circles are symmetric about the x-axis, we can take the positive roots of the circle equations.
The large circle has radius a, centered on the origin.
y = sqrt(a^(2) - x^(2))
If the smaller circle's center is some distance f away from the origin, with a radius of b, then;
y = sqrt(b^(2) - (x - f)^(2))
The point where they overlap is the point where the radial lines meet the large circle. Taking the angle as t, the line above the x-axis is;
y = xtan(t/2)
xtan(t/2) = sqrt(a^(2) - x^(2))
x^(2)tan^(2)(t/2) = a^(2) - x^(2)
x^(2)(tan^(2)(t/2) + 1) = a^(2)
x^(2) = a^(2)cos^(2)(t/2)
x = acos(t/2)
y = asin(t/2)
For a given distance f, the radius of the smaller circle is fixed;
asin(t/2) = sqrt(b^(2) - (acos(t/2) - f)^(2))
a^(2)sin^(2)(t/2) = b^(2) - (acos(t/2) - f)^(2)
b^(2) = a^(2)sin^(2)(t/2) + (acos(t/2) - f)^(2)
b^(2) = a^(2)sin^(2)(t/2) + a^(2)cos^(2)(t/2) - 2afcos(t/2) + f^(2)
b^(2) = a^(2)(sin^(2)(t/2) + cos^(2)(t/2)) - 2afcos(t/2) + f^(2)
b^(2) = a^(2) - 2afcos(t/2) + f^(2)
b = sqrt(a^(2) - 2afcos(t/2) + f^(2))
Using the integrals from the point of intersection to the end of the circle to find the areas, you can find an expression for the area of the "lune".
It's not something that simplifies into a y = f(x) sort of thing, though.
Area of lune = (af * sin(t/2)) - a^(2)t/2 + ((a^(2) - (2af * cos(t/2)) + f^(2)) (pi/2 - arctan((a * cos(t/2)) - f) / (a * sin(t/2)))
a^(2)pi / 10 = (af * sin(t/2)) - a^(2)t/2 + ((a^(2) - (2af * cos(t/2)) + f^(2)) (pi/2 - arctan((a * cos(t/2)) - f) / (a * sin(t/2)))
We need to find an equation that models the curve of the stick.
If y = f(x)
L = integral from 0 to 30 of √(1 + (dy/dx)^(2)) dx
You could take it as a parabola or a circular arc. They're both quite similar over the region you want. The length ends up being 30.0888 ft for the circle and 30.08865 ft for the parabola. A catenary arc, gives a length of 30.0887 ft
The difference is less than 0.05 mm
The stick is 30 ft 1 and 1/16 inches to the nearest 16th of an inch
Here is a graph of how the curves look
https://www.desmos.com/calculator/meryvz45ud
This gives variable values for h (the height of the arc above the horizontal), w (the angle of the tangent line), and t (the angle of the green line). It solves for the new radius and the angle alpha.
Unfortunately, there's not always a nice neat equation at the end.
You may be able to work through some of the formulae and simplify a bit, but I doubt it will come out that neatly
You're always better off replying in a comment, or making a new post if it's different enough. That way you get more people seeing it.
It's definitely a circle, but your sketch and the scale of the graph make it look otherwise.
https://www.desmos.com/calculator/kuue5ruhmm
This gives a more accurate view
https://www.desmos.com/calculator/awe5urbjip
Notice that the angle between each of the radius lines on either side and the y-axis is only 30 degrees, so the total arc segment has an angle of 60 degrees
Your sketch makes the angle look much larger
In the above link, you can change the angle t of the green line, and the value below gives the angle for the black line
Thanks for your help!
I ran through the problem, and checked it with a grapher, but I got it wrong. I have no clue what I did, unfortunately, and I'm not sure how to fix it. I managed to hit one of the turning points though.
This is what my graph looks like. https://www.desmos.com/calculator/maltjn7j6p If you could offer any potential insight, I'd be more than grateful. If not, I'm happy I got as far as I did so thank you very much! :)
Okay...
Let t = 0 be the moment the bottom right corner of the box touches the bottom of the ramp.
Let t = 1 be the moment the bottom left corner of the box touches the bottom of the ramp.
Assume the bottom left corner of the box moves at a constant speed down the ramp.
The coordinates of that corner, in terms of t, are:
L = [
-(1-t)√(2096^2 / (2096^2 + 333^(2)) × 450^(2)) ,
(1-t)√(333^2 / (2096^2 + 333^(2)) × 450^(2))
]
Now for some reason subscript isn't possible on /r/askmath, so I will have to call these coordinates L(x) and L(y).
The base of the box extends 450 units from this point (bottom left) to rest on the horizontal floor (bottom right). This is the hypotenuse of another triangle, so the coordinates of the bottom right corner in terms of t are:
R = [ L(x) + √(450^2 - L(y)^(2)) , 0 ]
I will call the x coordinate of this point R(x). The y coordinate is always 0.
Now we can determine the height, a, of the box's base directly above the point at the end of the ramp (which we have fixed as x = 0):
a = L(y) × R(x) / (R(x) - L(x))
Now we just need the vertical width of the angled box. We can draw a smaller triangle, similar to the triangle which the base has made (LR being the hypotenuse), and rotated 90° within the box to determine this:
h = 190 × 450 / (R(x) - L(x))
Finally, we "just" need to h to a and see if it ever exceeds 215.
Now I tried for a long time to work this all out fully, but it got way too complicated. So instead, here's a link to my Desmos graph:
https://www.desmos.com/calculator/gowtobbdnv
The peak of the final graph is at 208.433, so, long story short: yes, the box will fit.
(that graph looks like a quadratic, but it isn't)
That desmos really helps a lot, so it appears that that adding or removing a linear component moves the parabola on an inverted parabola (https://www.desmos.com/calculator/bhsefqtzvz)... that is very unintuitive but is amazing to see thank you.
I understand that the x^2 term dominates.
The shocking part for me is the fact that the graph itself is still: i) symmetric, ii) a perfect parabola, etc. I feel like it would skew the parabola but it doesn't,,, but I suppose I just need to get my intuition more aligned.
Numerically, x^2 just overpowers everything over time, so whatever distortion + bx + c introduces will always be just that, a distortion to a pure x^2 (i.e. it only tweaks it, it doesn't change its nature). For a dumb example, f(x) = x^2 + 3x, g(x) = x^2, g(1000)/f(1000) = about 99.7%. As you approach infinity, f(x) and g(x) become more and more almost the same, the relevance of the linear part smaller and smaller.
But at the same time, you do make it "more liney", it is just hard to see without the right tool, and not the sense you're thinking. Try to vary b here slowly, and notice how the segment right around the origin behaves (say from x=-0.5 to X=0.5)
Is this a real problem involving a real camera with multiple lenses? Compound lenses often cause some sort of distortion.
What do you mean by frame size and camera's x,y,z position?
You can move the black point around to see how its position on the sensor moves. Notice that due to the sensor being a flat plane, distance from the camera doesn't always affect the objects position.
If you know the object's position, you can translate that to a position on the sensor, but you can't always translate a position on the sensor to a position in real life.
If you have a position for an object, (x,y,z) - x going to the right, y going up, z coming towards us, with the camera at (0,0,0) and facing along the x-axis, then;
h/f = z/x
v/f = y/x
h is the horizontal position on the sensor, v is the vertical position, f is the focal length (distance from camera to the sensor).
The lens would also invert the image, so the coordinates of the point on the sensor would be (-f, -fy/x, -fz/x)
I missed some other mistakes, where I was confusing what I was writing here with what I was writing on desmos, so some of the trig functions were using the wrong angles
Here is my fixed version. I've scaled the f(x) line to be visible over the "Earth" part. The frequency moves over the range you give, so I think this is correct
Of course it doesn't account for the ellipticity of the Earth and the satellite's orbit, but it should be close enough
Okay, I think I got it. I made a function of distance/time based on the central angle measure and its derivative matches the expected shift almost perfectly
I'd made a mistake.
In the d1 equation, I needed to change the x to P, and then use d/dT (d1)
This gives the change in distance with time and gives more variation in the frequency
There may still be issues with the proper sign and magnitude of the angle P though
I'm sure there are other mistakes because the model doesn't seem to fit what it should. I keep getting a change in sign of d1 close to 180 degrees
Nevermind. I was taking the derivative of d1 but that's already the derivative
https://www.desmos.com/calculator/p6s6yvjv1p
This should be correct
The numbers don't quite match this thread but that might be due to the rounded numbers for radius and height and the fact we're not taking the eccentricity of Earth into account
You're free to use this however you please. Glad it helps
Have you tried plotting the graph of the equation?
Here is the graph: https://www.desmos.com/calculator/fnrc2vmlk8
Look at the value of t for which I(t) is 0 i.e the strength of the infection is zero.
If you're talking about a straight line from the top of the quadrant to the bottom-right, then it would have a slope of -1
78.5" is the length of the arc from the top to the bottom-right
If you want the slope of the curved section, it changes. At the top the slope is 0 and at the bottom-right it approaches infinity