
What is Reddit's opinion of
GeoGebra?
From 3.5 billion Reddit comments
100 reviews of this app found across Reddit:
I try to ELI5 as best as I can.
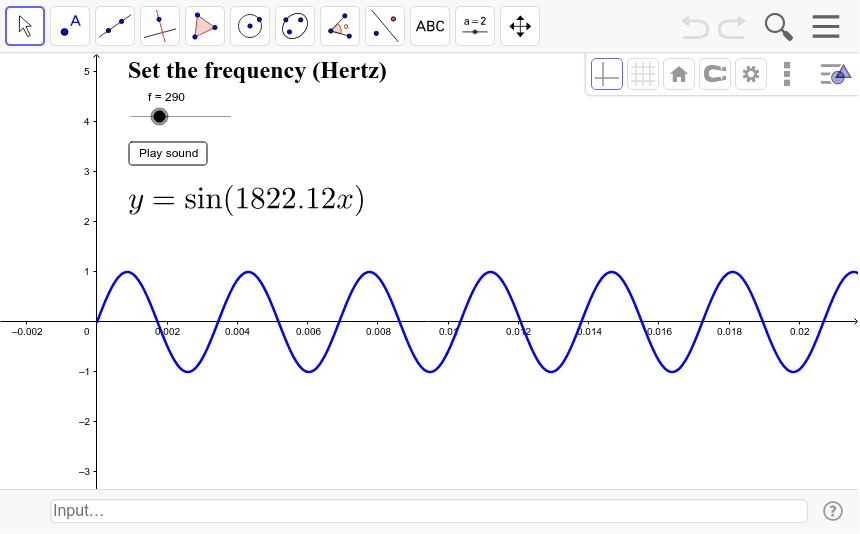
In quantum mechanics, particles behave like waves. Keep this in mind.
Look at this wave (it's supposed to go off to the left and to the right like this into infinity). You can easily tell me what wavelength it has - just count the distance from one peak to the next one.
But where is this wave? This question doesn't even make sense, the wave goes off like this on both sides to infinity. It has a very well defined wavelength (~velocity), but the position is totally unclear.
Now look at this wave. If I ask you "where is it?", you can imemdiatly say "it's at (or around) 0". But what is its wavelength? There isn't another peak you can measure the distance to.
This wave has a very clearly defined position, but the wavelength is undefined.
And you can make up all sorts of "mixed waves" between those two examples, but you will always trade uncertainty in one for exactness in the other.
https://www.geogebra.org/ geogebra has some great tools for that. Play around with it on desktop if you can!
Mathematica is good too, though I've only ever tried the free version they package with the raspberry pi os for desktop use... I think you might otherwise have to pay or get a license through a university.
I know Geogebra is free and really user-friendly. It's great for high school level math, and there's also a free tablet version available as well. I'd highly recommend it for your student.
Upvote so others can see this comment.
Tips are:
- The unit of Z is damage
- One of you said that red was AD and green was either crit or fury. This is correct.
- The strategy is not new but as far as I know, no one has optimized it yet (which might explain why it's not well known)
- One of you asked for the graph and here it is. If you copy paste:
f(x,y)=If(0≤x≤400 ∧ 0≤y≤100, (y)/(100) (0.75 x-175))
In geogebra 3D, you'll get the 3D graph.
What exactly makes you think that? The fastest ~~point~~ path between 2 points is a brachistochrone curve. It changes when the points change. So of course the two examples won't be identical.
I'm really not sure why so many people are getting confused over this. You can play with it here: https://www.geogebra.org/m/bHQNJvZC
Notice the steeper the slope between a and b, the closer it resembles the vsauce video. The more gentle, the closer it resembles the simulation.
I think it's most likely they're using this, one of the standards for epidemic modeling:
https://en.wikipedia.org/wiki/Compartmental_models_in_epidemiology#The_SIR_model
In the SIR model, the R stands for removed, and it's a lump grouping that has both deceased persons and medically recovered persons categorized together. Its purpose is to denote the population that are no longer Susceptible (able to be infected, a key assumption being that infected people can't be reinfected) but are also not still Infected. I have no problem with them reporting this number, so long as they continue to make it clear they're reporting the removed count and not explicitly calling it 'recovered or healed.' My Spanish isn't great, so I couldn't pick out precisely what word he called it, but I could hear that he went on to specify the definition as given by international standards (I think he was offering that removed definition above). Definitions disclaimers like seen in the video seem a fine way to go if that R figure is what they're choosing to publicize.
Here's an online SIR model you can play around with to see the model in motion:
"wage growth slow down is an oxymoron"
Imagine the line is wage growth.
Over time, the growth is slowing down.
Technically yes, but it's somewhat unsatisfying without regular polygons. There are only 3 regular shapes that tessellate: squares, equilateral triangles, and regular hexagons.
Feel free to play with this: https://www.geogebra.org/m/bHQNJvZC
It will draw the brachistochrone curve between two given points. If you want to mimic the video, put point b somewhere near the bottom of the cycloid. That's exactly how they made it, actually. If you want to recreate the simulation, put point b somewhere on the far side.
Well, I did it on something called "GeoGebra" and in CAS (a function within GeoGebra). It's basically a maths-program which lets you find values for limits, draw graphs, etc. You basically just use a computer program to do the calculations. Answered by someone still not started calc 1 class (19y/o). Here's the link if you don't have it: https://www.geogebra.org/download
But what does that have to do with perspective?
From the subreddit description:
> Forced perspective is a technique that employs optical illusion to make an object appear farther away, closer, larger or smaller than it actually is. It is used primarily in photography, filmmaking and architecture. It manipulates human visual perception through the use of scaled objects and the correlation between them and the vantage point of the spectator or camera.
Would this look less or more confusing from a different camera angle? If the answer is no, then it has nothing to do with perspective.
Also the first rule:
>This subreddit, /r/confusing_perspective, is for the sharing and discussion of photographs or videos taken from confusing perspectives. If your submission is a meme, a cartoon, a sketch, or otherwise modified or designed to deceive the viewer, it will be removed.
Since this is a 3D render deliberately made to show this property where a point on a spinning disk, which is also revolving eccentrically, is following a straight line if it is the right distance from the disk center, which is in fact a special case of a hypotrochoid, I think it's violating this rule even disregarding the fact this is not about perspective at all.
This is basically just a fancy spirograph. Here, try for yourself and set the ratio of radii to 2 and the distance as a fraction of r to 1. I don't find anything confusing on this, let alone a confusing perspective. There's no perspective on a 2D plane.
There is a very fine line between the diffrences between them. SARS, MERS and COVID-19 are all respiratory illnesses that are caused by the same large family of viruses called coronavirus. Coronaviruses are actually quite common. They are the source of many of the common colds that people get and recover from every day. The important thing to remember is this is whatever you want to call it it is much deadlier than the public is giving it credit for.This virus is growing exponentially faster than any of its cousins,at the rate this is growing the total number of people infected could EASILY top a million. Stay safe yall...
Pi is not an invented number but a discovered number. Mathematicians discovered that if you compare the circumference to the diameter of a circle, you get the same ratio. That means that if you measure the outside of a circle and divide it by the distance across the circle, you always get a number incredibly close to 3.14159 (accuracy is dependent on your measurement tool and how "perfect" your circle is).
If you want to know where the area formula comes in, go to the link below and click "Start Show."
The viewing deck of the Tower is at 1122 ft, and the antenna goes up to 1,815 ft. You can see about as much of the tower below the antenna as you can see of the antenna, meaning, about 400 something ft or more of the tower is hidden by the horizon. There appears to be very little refraction going on.
According to my Earth Curve calculator over at geogebra.org, accounting for standard refraction (K-factor of 1.17), from a distance of 30 miles, 410 feet should be hidden from view for a person with a viewing height of 6 feet.
Also hidden behind the curve of the Earth is Centre Island, surrounding the waters in front of the CN Tower.
400 feet of the tower is hidden from view, along with all of Centre Island. You have confirmed that the Earth is in fact spherical.
So I'm actually one of the guys mentioned there. Here's a Geogebra thing I came up with illustrating some of the sets of solutions not mentioned in the article.
Maybe look into GeoGebra https://www.geogebra.org/ I don't think that it does exactly what you want (since you seem to be looking for an "automatic" solutions) but you certainly can draw polygons whose sides are incident with given angles.
People posted Wolfram already, but Geogebra is also pretty cool. It will let you put in in a function and show you the graph and shenanigans like that.
https://www.geogebra.org/classic?lang=en
If you want to learn the guitar, Justin Sandercoe is pretty awesome.
Two recommendations : 1. tinkercad is great for beginners with zero experience. Its free for everyone. Not that powerful (even compared with sketchup) but for basic shapes and figures, it's perfect. 2. Geogebra Isn't so much for modeling 3d printable files. But it's more math focused. It's kinda more like desmos-3D.
x(t) = a sec t and y(t) = b tan t are the parametric equations for the hyperbola with Cartesian equation x²/a² - y²/b² = 1. I was trying to find out why this is and I found this web page (which I found from this Maths StackExchange answer) the most helpful.
Here’s a GeoGebra thing I found the other day that shows what lengths sec, csc, and cot correspond to when you draw a tangent to a point on the unit circle.
I don’t really know any other geometric applications (but I just learned the reciprocal trig functions a few months ago, so I’m not that familiar with them yet).
I would use https://www.geogebra.org/classic, and then input the formula with variables that's appropriate for you. Take a look at the example for more inspiration :)
There isn't even agreement what is difficult to play. Plenty of people say CK2 is the easiest while others say it's one of the harder ones.
At that point we might as well just get rid of any notion of objectivity and add another entirely subjective axis: fun
So here is my version of this graph (also I got rid of the silly inaccessiblity-streamlined axis that doesn't make any sense)
Any math to back up your claim?
The experiment would only work on two locations. Add a third one, and you'll see why it's wrong.
Also, if the Sun was 3000 miles up and 32 miles in diameter, then:
-The sun would never set.
-It would change both in angular size and speed. Which doesn't happen when you watch the Sun with a solar filter over the course of a day. Here's a model to demonstrate how your sun would look like.
> 8 inches per mile squared is a figure anyone can go out and see curvature over the horizon and also left to right
Are you considering the height of the observer or the fact that there is terrain such as hills, valleys and mountains? Here try this.
>ships that go out of sight due to perspective easily come back to eyesight zooming in from camera, binoculars etc
Have you tried this or just watched some pro-flat videos?
How about you explain why I know for a fact that the moon will be a waxing crescent on December 31st or why there will be an eclipse on August 21, 2017?
Geht schöner, aber hier:
(im Bild von links nach rechts)
Mund links:
if (0<x<2), f(x) = 1/20 * (x-5)^2 + 2
Linker Zahn:
if (2<x<4), g(x) = |x-3|+ 1 + 9/20
Mund Mitte:
if (4<x<6), h(x) = 1/20 * (x-5)^2 + 2 + 9/20
(also im Grunde f(x) + 9/20)
Rechter Zahn:
if (6<x<8), i(x) = |x-7| + 1 + 9/20
Mund rechts:
if (8<x<10), j(x) = 1/20 (x-5)^2 + 2
(also wieder f(x))
​
Wenn ichs richtig verstanden hab (benutze geogebra selten), sollte man das mit dem Link hier sehen können:
In Geogebra, put this in to the right hand side: 12y^2 * (y/3 + 9x/y^2) = 4y^3 - 72 after clicking enter it should show up as eq1 then put in a new equation y = 0 it should show up as f Now put A = intersect(eq1, f) it should say undefined
Edit: Forgot to add parenthesis
That's true as long as you do only one multi,the more you roll the less the %increase becomes.
I've made a geogebra graph to show this,at 300 SQ the gain falls to around 17% and at 600 SQ it goes as down as 10%
If that seems strange think like this:suppose we use 699SQ,this gives us an 80.5% chance of getting at least 1 SSR. If the %increase stayed at 25% we'd get a 100.625% (80.5·1.25) of getting at least 1 rate up SSR which is obviously not true.
I DO agree that it's better to wait for the anniversary before spending SQ if possible but I just wanted to share my opinion,I hope I have not offended you
I always enjoyed connecting the values of the trig functions to the unit circle. Each of the functions has a geometric interpretation which helps with gaining intuition. Check out this link for example: https://www.geogebra.org/m/keqhdkaj
Visibility calculations require atmospheric refraction calculations which are admittedly complex. However, I have seen no math that explains how objects on the horizon, on flat Earth, are cropped on the bottom, sometimes by hundreds of feet.
Follow the daily debug for a whole bunch of high school level math.
One of my personal favorites is this:
https://www.geogebra.org/m/2363491
It was a created with high school level math according to flat Earth specifications. It does not match real world observations.
Another personal favorite is this:
How can the setting sun cast light and shadow onto the bottom of clouds if the sun is always 3000 miles above the Earth?
If you straighten that curved part that measures 47' into a line, the region would measure about 33100 square feet. A bit more than 3/4 acres.
Here's the GeoGebra file if you want to play with it.
Hier gibt es bei Geogebra ein verschiebbares und drehbares Geodreieck auf Karopapier. Schade ist nur, dass es sich nicht in Freihandskizze als Lineal benutzen lässt - aber wenn man stattdessen Geraden nutzt lässt es sich wunderbar zum Messen und Zeichnen nutzen.
There are definitely missing givens as has been discussed below, You can check this geogebra sketch you can play around with to see there are many different triangles that match those givens.
Well, Labor's share of income has been declining over the past quarter century.
Whether or not compensation is pacing productivity is probably less relevant than something like the Iron Law of Wages.
I prefer the math version....
> crosswind = wind speed * sin(angle) > > headwind = wind speed * cos(angle)
...or you can use the aviation charts to calculate this of course, but I find learning the true math more useful. Then the E6B or other aviation calculators you may use in practice make more sense as for what they are doing -- and why its not linear.
Longer doc: https://www.ivao.aero/training/documentation/books/PP_ADC_Headwind_croswind_calc.pdf
And a neat visualizer for why it works with sin/cos: https://www.geogebra.org/m/fEyWRUX3
And there are lots of mental shortcuts for approximating the crosswind component too, that are useful to remember: crosswind of 30' = 50%, 45' = 70%, 60' = ~90%.
I've been trying to find time to play with Geogebra which lets you make interactive models much in the same way as the article has, not necessarily related to algorithms, though.
That's it! The larger resistor means that when the inductor becomes conductive, the total current is U/R. If R is larger, the inductor doesn't have to store much energy to reach that current flow.
There is a geogebra worksheet that visualizes this:
Yes. Maybe this little geometry applet will help you understand. Imagine the circle is the face and point A the camera. You can drag the point A with your mouse. The closer you get to the face, the wider the camera's field of view must become in order to still capture the entire face. And up close, you'll see any protruding strand of hair from below, rather than from the front as with larger distances, causing a radically different appearance. That's what perspective "distortion" is all about!
Using various digital platforms and softwares to aid learning by visualization, active learning,using other blended learning techniques etc , especially for science students.
For ex- There's desmos a graphing calculator and similarly geogebra for 3D calculator, geometry etc, these softwares can enhance student's math learning experience.
Similarly there's molview for chemical compounds and bonding visualization which can enhance chemistry learning experience.
Likewise there would be many such services/softwares and we should also make a list of them to help students learn better!
If you're ok with an extra axis then GeoGebra should do the trick.
edit: Ah, wait a minute, GeoGebra only goes to 10^9 . I don't think it's possible to have a zoom-in-able number line that goes arbitrarily large, considering that there are numbers that take an arbitrarily large amount of information to specify. (That is, provided you want a guaranteed level of precision, such as to the nearest integer.)
I think the “straight angle” part is more confusing than necessary. Easier to just say that the interior and exterior angles at each vertex add up to 180°, and then include a diagram showing what “exterior angle” means, since this is not obvious to someone who hasn’t studied it before.
/u/lieutenantseaanemone try dragging the blue points around: https://www.geogebra.org/m/aJZAa9zF
No, I'm not missing that requirement. One of the sides adjacent to the 30 degree angle is arbitrarily short, but there is still a 30 degree angle present. The other three sides are almost 20 long, and the area is almost the area of an equilateral triangle.
Edit:
Someone at the blog linked to this. Drag point D almost to point A. You end up with a concave quadrilateral, but there's no requirement given that it needs to be convex.
Cube can appear larger when viewed obliquely. Sphere doesn't suffer this. Sphere is better.
Used this little thing to make those: https://www.geogebra.org/3d?lang=en
You could also include the angular diameter of the Moon, as well if it would set or not on a flat earth.
>not sure what that video is supposed to show it looks like a light bulb inside a ping pong ball being shaken around violently, it doesn't show angle
You said that the reason the Sun appears to set is because it goes too far away, right? The entire point of the video was to show that the Sun doesn't change in either size or speed over the course of a day. How is that possible in your model?
The video that you showed made a claim backed up by nothing. Can you show me as to why the Sun/Moon would take that path on the globe earth model?
>and yes the sun does get bigger or smaller and it's excused as perihelion and aphelion, but what they can't hide is how the sun moves
Yes, and who's denying that? I'm talking about a change in the Sun's size and speed over the course of a single day.
Here is a model to help you visualize what I'm talking about.
Just to extend on this, here are two visualizations:
The Sun's angular size as a function of latitude and altitude of the observer and how it would look like from the ground
Credits to /u/DethFiesta who originally linked to it here
Edit: a letter
I always wanted to hit my players with this a set of runes, 3x3. Some of the are glowing. If you touch one rune, the rune you touched and the neighbouring runes will change state. The goal is to make all runes light up. here in an online version of this puzzle.
>have it installed.
Geogebra has a range of online tools that you can use right in your browser.
On this website https://www.geogebra.org/download for most of the offered tools it say "START" besides "DOWNLOAD". When you click on "START" you launch the respective web application.
You can bookmark the web applications directly, to launch them without going through the aforementioned website.
You can use the command Zip()
https://www.geogebra.org/m/hxqrjytf
See full Script below which is included in the link too. However, there might be better ways to do it.
text = {"G", "E", "O", "G", "E", "B", "R", "A"}
n = Length(text)
Ln = 1..n
A1 = (-16, 6)
A2 = (-14, 6)
A3 = (-12, 6)
A4 = (-6, 2)
A5 = (-2, 10)
A6 = (4, 6)
A7 = (6, 6)
A8 = (8, 6)
c = Spline({A1, A2, A3, A4, A5, A6, A7, A8})
t = Slider(0, 0.8, 0.01, 1, 180, false, true, false, false)
A = Point(c, t)
B = Point(c, t+0.2)
shortCurve = Curve(x(c(t)), y(c(t)), t, PathParameter(A), PathParameter(B))
Lt = Sequence(k, k, 0, 1 - 1 / n, 1 / n)
Lslope = Zip( Slope(Tangent(Point(shortCurve, t), shortCurve)) / (2π) * 360, t, Lt )
Llatex = Zip( FormulaText("\mathbb{\bf{\scalebox{2}{" + txt + "}}}"), txt, text )
Lmotion = Zip( Text("\rotatebox {" + ps + "} {" + txt + "}", Point(shortCurve, (k - 1) / n), true, true), k, Ln, ps, Lslope, txt, Llatex )
On construit en premier le point "omega" (centre d'homothétie des deux cercles) puis le point J . Voir fichier joint .
It'd be useful if you elaborated a little on what exactly you can't understand, as someone already said. Have you tried understanding it in a visual way? Sketching them yourself or plugging in different values? Do you know about relation to trig tan function?
Maybe try using this.
Once you try to expand on what is troubling you, you'll have easier time understanding it and seeking help.
If you draw a circle centered at W with radius 5.6m you'll find the line extending from VU will also intersect the circle at another point, call it U'. WU' is thus also 5.6m (since it is also a radius of the circle) and you have another triangle that meets the criteria in your picture. The angle WU'V is 43.69 but the question is about the triangle with the obtuse angle.
I threw a few iterations into geogebra, and there's some interesting behavior. https://www.geogebra.org/graphing/sces7bne
These (very anecdotal) observations all assume that z*0* = 0.
when the imaginary component of c is positive, z appears to converge near c. This implies that our divergence condition should not be based on magnitude of z, but z's distance from c.
when the imaginary component of c is negative, z sometimes(?) converges to a finite, stable orbit (c = -3.5 - 1.07i).
sometimes, some of the orbit it converges to are immensely far away, although the orbit is stable (c = 8.5 - 7i). If this is accurate, this means an accurate divergence condition cannot be based on magnitude at all.
Forgive me if i'm not using certain terms correctly, not super familiar with this subject
Thanks, I got it already thanks to edderiofer. My old CAS and my calculator did it automatically, so I was a bit confused. I don´t actually use Google, I use GeoGebra, Google has just shown the same result so I didn´t have to upload a picture.
Say you want an arc that is defined by a cord of length d and height h. Without even needing to solve for the radius, you know that the angle formed by one end of the chord, where the arc peaks, and the other end of the cord is going to be constant at all points on the arc. Here's a visual to convince yourself.
Take a straight edge (preferably one that exceeds the chord length) and fix one end of it at one end of the chord, pointing the other end at the peak. Measure and maintain the aforementioned constant angle as you increase the angle made by the chord and straightedge, marking the position at which the constant angle exists between your measuring device and the ends of the chord, as you slide your measurement device down the straight edge to the end at the chord.
The marked positions will trace out your arc, at least in theory. I'm not 100% sure of how well this would work practically but then again if you need to use this method practicality has already left the building. Feel free to ask for clarification.
I wouldn't disagree that it favours tier 10 and longer term players. But there is good rationale for this. It's much harder to play at a high level in a tier 10 at a consistent rate, the level of play is generally much higher than at other tiers (provided you aren't just top 3 all day long and laughing to the bank).
Second, experience is generally correlated with player skill. You've run into the situation before, you know how not to deal with it so you may stand a better chance at the scenario than a player who hasn't been there done that.
I would also say that the contribution of battles is relatively small. For example, if you were to maintain your current performance then wouldn't reach 9000 performance rating until approximately 138,000 battles. link to graphic calculator
On the other hand, if you had won an extra 0.5% of your battles, survived an additional 7.25% of your battles, done an extra 600 damage per battle, earned an extra 200 xp per battle, and doubled your average assistance per game you would have passed the 10k WGR at the 17,000 battle mark.
Here's a sketch (imgur):
Here's a dynamic drawing you can rotate in space by dragging:
It looks like the angle is about 105.4°.
Your answer of 19.84 is correct.
If the equation sillytodothis11 gave you seems to hard to solve, consider this instead.
Call QC = x. Then PC = 4sqrt(6) – x.
R^2 = (x)^2 + 6^2 using one right triangle.
R^2 = (4sqrt(6) – x)^2 + 4^2 using another triangle.
Since both of these are expressions for R^2 you can equate them.
x^2 + 6^2 = (4sqrt(6) – x)^2 + 4^2
Expand that all out and then you can solve for x because it turns out to get rid of the quadratic terms.
Once you know QC = x, you can find R just by plugging it into a right triangle: QC^2 + 6^2 = R^2 and solving for R.
https://www.geogebra.org/graphing/ueBvcNCm
Then double R to get diameter of the circumcircle.
>What's the proof of this law?
the cavendish experiment.
>focaults pendulum wouldn't need initial force to start
the movement of the pendulum just makes the observation visible. also how does it work on a flat earth? because it is a way of seeing the Coriolis effect, which only happens on spinning objects.
>and star patterns would change more than what is witnessed when a plane travels north to south and south to north but they don't.
citation needed.
>How so?
no decrease in angular size, no decrease in angular speed and it also goes below the horizon. heres a simulation to show just how much the sunset fails https://www.geogebra.org/m/C9BcVgd4?doneurl=%2Fsearch%2Fperform%2Fsearch%2Fflat%2Bearth
Holy shit this visualization is awful. Guys, get yourself Geogebra, that way you actualy have interactive materials to figure shit out. I built an animated kinematics scheme for my bachelor's degree work in it and received an A for that. Since it's not some black box CAD that figures everything out for you, you actualy learn how everything works.
Cursory search gives me this and this. Probably not exact, but at least from the first one you could build this. If you download it, you can actualy see a construction protocol of how this was made, step by step. And I haven't even tried specifying search, so maybe you can find this exact problem.
I made an interactive applet that answers your question. A ship on the horizon will tilt 0.04°, and won't be tilted a full degree until it is 69 miles out, but won't be visible behind the horizon.
> I guarantee you've never looked through a telescope
I have. A lot. The stars can't be resolved, obviously, as anything but a point of light. The planets, however, are easily recognized as spheres, because they have a discernible terminator, just like the Moon. Saturn has rings, which you can see going behind it. Jupiter has its weather bands. Venus has a terminator. Speaking of the Moon, it's easy to see that it's a sphere, because you see the shadow of the terminator as an arc. If the Moon is not a sphere, it has to be a hologram of some sorts, which is, quite frankly, madness.
>If you are at a higher altitude, the sun will appear to 'set' later due to perspective
Have you seen this? How can you prove that this model of FE is wrong?
Have you looked into GeoGebra? It's perfect for that kind of Euclidean geometry play. The GIF exporting feature is a bit annoying to work with, but if you're just looking to understand things yourself then you don't want GIFs, you want interactivity!
GeoGebra offers a whole lot of features that deal with the postulates, and you can drag objects around and have the relations update automatically. It's really awesome. Give it a try!
Wolfram|Alpha can be used on its website. Geogebra can be used offline. Desmos is probably the easiest to use if you've never used graphing software before, but they are all beginner-friendly. All are free.
Sure, when earth is at aphelion then the sun will have a smaller angular size compared to when it is at perihelion however in a single day this isn't going to be noticeable. Here is an example showing aphelion in July and perihelion in January. Here is how the sun's angular size would change daily on the flat earth.
You'll have a hard time getting a flat earther to believe any photograph that disproves their position. The flat earth sits on conspiracy after conspiracy. They deny the science they dislike and embrace the science (from the same group of scientists, ironically) that they like.
Take a look at this u/benf101. It's nearly impossible to detect the curve with the naked eye. https://www.geogebra.org/m/3130963#material/xjUgtYYj
Have you had no experience looking at a surface that looked absolutely level and then you put a level on it and you were wrong. The surface was down a half centimeter on one side. Our brains aren't equipped to differentiate between such small ratios.
As far as the centrifugal force, you can experience it at the equator. The effect is enormously small and gravity overpowers it so much that it is negligible. Our intuitions fail us all the time. That's why we use non-biased science. Go weigh yourself then do it again at the equator with a very precise scale.
God forbid you believe anyones word who disagrees with you.
GeoGebra Tube has a huge number of proofs and interactive demonstrations. Not an app but it runs well on tablets. I haven't tried it on a phone. https://www.geogebra.org/materials/
You're looking for something that simulates using a compass and straight edge, but not something that can make circles and lines? It's not clear what you're looking for.
My first thought was Geogebra. It has many more features than you seem to be looking for, but you could simply limit yourself to the Point, Circle, and Line tools.
Here's a nice tool to visualize what's going on. You can play with a lot of different parameters on there, but start by moving the slider for a up to 5 to see what happens. That should illustrate the concept nicely.
You mean like this?
https://www.geogebra.org/m/wadr5rx2
Then you can solve it with trigonometry: tan(angle) = opposite/adjacent. You're searching for the length opposite of the angle, which gives you opposite = adjacent·tan(angle).
you can name a and b as x,y then c and d are functions on x y, then you have four inequalities
draw them. Each point in solution give you a and b, the functions give you c and d
then open here. https://www.geogebra.org/m/vzqh3wmx
cc and dd was calculated with CAS but I found a bug: when I do an inequality in CAS and upload the applet it says error
Ok, I've found the answer: You have to integrate h5p on your own wordpress page and then integrate the link in your Geogebra Book. Here's an example:
At the end of yout html file add these line:
<script src="https://www.geogebra.org/apps/deployggb.js"></script>
<script>
var params = {
"width": 800,
"height": 498,
"material_id": "rct2f5us",
"borderColor": "888888",
"playButton": false,
"showFullscreenButton": true,
"enableShiftDragZoom": true,
"showResetIcon": true };
var ggbApplet = new GGBApplet(params, true);
window.addEventListener("load", function() {
ggbApplet.inject('ggb-element');
});
</script>
Then add in your body tag:
<div id="ggb-element"></div>
Here you can see that it works using iframe or deployggb.js
Yes, it is a great resource.
Here there is a couple of more resources that you might find interesting:
Logo dediğin sadece arabaya konmuyor. Bilboarda da web sitesine de konuyor. Onun icin tüm firmalar logoları basitleştiriyor. Eski logo svg olmaz ama yeni logo olur. Türk milletinin huyu her boku bildiğini sanması. https://www.geogebra.org/m/KkAEnwpE
>This is almost what I need! The only thing that I need now is for it not to reset the variable(the value in your file) to zero. But instead if should count on untill the next multiple of 120. I was thinking of maybe having condition a=0 (mod 120) or something like that.
Something like this?:
With the lambda thing, I presume you are now doing the vector equation of a line - here's a little GeoGebra example to play with - you can move the point A (to change the position vector OA) and the vector BC and see the effect it has on the line r= OA + k(BC)
You can also alter k to see the point move along the line.
Hope it helps.
ניסיתי לחשוב על אתרים פחות מוכרים ולא עלה לי כלום. בכל זאת, למי שלא מכיר את האתרים האלה: Desmos יכול לשרטט לך את הגרף של כל פונקציה שאתה יכול לחשוב עליה, ו-WolframAlpha הוא מנוע חיפוש חישובי שמסוגל לחשב דברים מורכבים יותר ממה שרוב המחשבונים יכולים, למשל משוואות דיפרנציאליות
עריכה: גם GeoGebra 3D Calculator זה אתר לא רע, זה כמו Desmos רק לפונקציות תלת מימדיות
Bueno las cuentas son claras y ya te comentaron el por qué de cada paso. Te recomiendo que lo veas graficamente: https://www.geogebra.org/calculator/zgpm6smv
Ahí a representa tu variable lambda. Con la barrita moves el a y ves qué pasa con tu recta a medida que varía ese coeficiente. Algunas cosas que se ven a simple vista: la recta siempre pasa por el (0,0), el círculo está fijo y su circunferencia pasa por el (0,0), por lo tanto ese es un punto de corte entre la recta y la circunferencia.
Lo que querés encontrar es el otro punto (x,y) donde la recta corta a la circunferencia, que necesariamente van a quedar en función de lambda. Una vez tenés esos puntos, querés ver cuándo la recta es tangente a la circunferencia. Para eso (x,y) tiene que ser igual a tu otro punto de corte, que es (0,0). Entonces igualás x=0, y=0, y ves la condición que se impone sobre lambda.
there was an error in cell $11 in CAS. I suppose that m1=? is the cause
try to download as ggb this file and debug redoing last steps
https://www.geogebra.org/classic/c3rgvppf
I think better one translation and one rotation for getting reduced equation of conic. without CAS
no sé donde estará, si lo hay, el error pero aquí están mis escuetos pensamientos sobre este tipo de cosas
intenté hacer una herramienta que desde el triángulo me creara cada exágono pero las herramientas en 3D funcionan pocas veces
you can try xmin=0 , xmax=1 , ymin=0 , ymax=1-x , zmin=0 , zmax=x^2+y^2 in
https://www.geogebra.org/m/jrmzqk5z#material/mqwp4x2y
or another in the book
You can think of a * b as an area of sides a and b. So in this sense multiplication is simply calculating an area, like this. In the link, you have a number of squares, but you can instead use lines. Do you want to calculate 11*3? Simply draw 11 lines and 3 perpendicular lines and count the number of intersections.
Now to the "Japanese method". Imagine you want to calculate 42*21 like in the video. Forget the video for a second and just draw 42 horizontal lines and 21 vertical lines and count the number of intersections, that's the result.
The problem is, that's a lot of lines!
What you can do instead is group some of the lines, let's say, in groups of 10. To make them different, you can paint these. So a black line is a 1, and a blue line is 10.
Every time a black line crosses a black line you count normally, it's a regular multiplication. When a blue line crosses a black line, you have 10 lines crossing 1 line, so in this case, each intersection counts as 10. And finally, when you have two blue lines crossing, each intersection represents 10 lines crossing 10 lines, so that counts as 100. Your result is:
100*number of blue-blue crossings + 10*number of blue-black crossings + number of black-black crossings.
Instead of grouping by color, you can group by position, and that's how the method shown in the video works. You make a grid that is at 45 degrees and get 1, 10, 100... lines separated by a space. So each region corresponds to 1, 10, 100, 1000, and so on.
To multiply polynomials you do the exact same thing, but you don't group by 10, you "group by x". The line with a different color is simply a group of "x numbers of lines". Then you carry out multiplication as before.
I hope this is clear. It would be better with drawings but I don't know of an easy way to make those here.
Hmmm, ni siquiera se me pasó por la cabeza usar distancias, jeje. La idea es interesante. La otra modificación (de, en lugar de usar una función con el comando If usando el comando LineGraph) creo que no es importante (de hecho, definí una función i (d) = If (d> d_max, 1) y todo funcionó normalmente ).
Pero solo para un agujero, mi solución comparando los cosenos también funciona. Hice un applet más organizado si queréis consultar: https://www.geogebra.org/m/m9k53uzd. El problema surge cuando trato de construir más de un agujero: pude hacer esto comparando los cosenos y funcionó durante un tiempo, luego se produjo el error.
Además, intenté hacer 4 agujeros en la esfera usando distancias como criterio de comparación, y también ocurrió el error. Eso significa que el criterio de comparación no importa tanto.
Mientras hacía las pruebas y escribía esta respuesta, creo que descubrí el problema: parece que el error solo ocurre cuando pongo la comparación A == (0,0,0) en el If. Sin eso, ambas soluciones parecen funcionar. Probado con otras formas, como |A| == 0, o x (A) == 0 && y (A) == 0 && z (A) == 0, pero todos fallaron. Mi idea era, cuando A = (0,0,0), que el agujero no debería hacerse. Tendré que buscar otra forma de solucionar esto ...
No voy a etiquetar esta publicación como respondida porque, aunque descubrí el error, sigue siendo un bug sin resolver.
Bueno, muchas gracias por todo!
I believe is because you are using the 3d appl. If you open it with classic app, I think it works:
https://www.geogebra.org/classic/vbzbrsnj
Does this help?
GeoGebra does not have (at least for the moment) a system that detects overlaps automatically, so we must create a custom system for each type of object. For instance:
yo entendí que querías crear el polígono sin especificar los vertices antes de la creación del polígono, no pensé que querías recorrer un polígono como una curva para hacer que vaya apareciendo poco a poco
problemas de lenguaje
Take a look here and fiddle with the two sliders for a few minutes:
https://www.geogebra.org/calculator/swu5fvhx
See how cosine and sine can take negative values for certain angles? Triangles don't have negative lengths, but vectors could point into directions with negative coordinates.
Hello u/walter_fuechte
Pls CLICK HERE for example of point "D" is my required object which doesn't change position by dragging coordinate and zoom in/out. But according to my techniques point "D" is controlled by B & C which i don't want. I want point "D" moves by mouse.
I'm afraid no. The Graphing calculator hasn't all the GeoGebra Classic commands, because of some restrictions which are necessary for using it for exams in some countries.
Can you use the GeoGebra Suite instead? you can use it online here https://www.geogebra.org/calculator
or search on PlayStore / AppStore for the version for your device (phone, tablet)
It sounds like you are talking about a paraboloid surface.
This link will give some insight into finding the area within the 10 x 10 square you want.
So you have an equation for the paraboloid surface z = x^(2)/a^(2) + y^(2)/b^(2) + c, and you have the limits of -5 <= x <= 5, and -5 <= y <= 5
You said you want the curve to be at 2 ft high in the center of the walls. This means the new surface will be higher at the corners.
Or you can have the height be 2 ft at the corners, but it will be lower at the centers.
Option 1:
The surface passes through (0,0,-2), (-5,0,0), (5,0,0), (0,-5,0), and (0,5,0)
-2 = 0/a^(2) + 0/b^(2) + c
c = -2
0 = 25/a^(2) + 0/b^(2) - 2
25/a^(2) = 2
a^(2) = b^(2) = 25/2 = 12.5
So the surface is given by z = x^(2)/12.5 + y^(2)/12.5 - 2
At the corners, z = 5^(2)/12.5 + 5^(2)/12.5 - 2 = 2 + 2 - 2 = 2
So the new surface is at its lowest in the center, at -2, then in the middle of each wall, it's at 0, and the corners rise up to 2
The area is the double integral between -5 and 5 of the square root of (1 + (dz/dx)^(2) + (dz/dy)^(2))
The solution is 118.9 ft^(2)
Option 2:
The surface passes through (0,0,-2), (-5,-5,0), (5,5,0), (5,-5,0), and (-5,5,0)
-2 = 0/a^(2) + 0/b^(2) + c
c = -2
0 = 25/a^(2) + 25/b^(2) - 2
25/a^(2) +25/b^(2) = 2
1/a^(2) + 1/b^(2) = 2/25
The surface is symmetrical, so a = b
2/a^(2) = 2/25
a^(2) = 25
So the surface is given by z = x^(2)/25 + y^(2)/25 - 2
This surface has the center at -2, the corners at 0, and the middle of each wall will be;
z = 25/25 + 0 - 2 = -1
The area is the double integral between -5 and 5 of the square root of (1 + (dz/dx)^(2) + (dz/dy)^(2))
The solution is 105.1 ft^(2)
u/mike_geogebra and u/Roman_Chijner
Thanks for the answers.
Really, Roman, I need to specify the alternative command, but, even though, the n>3 doesn't change the background color. So, I used the suggestion from Mike and, yes, just worked if I put the command in the On Update script.
Why for the symbolic answers only work in the On Update script? Do you know the reason for it?
Hi and thank you for your prompt reply.
Your insight was fantastic.
In my specific problem I am dealing with a circle where I have the perpendicular axis, the centre point and the radius but no point on the circle itself is given. Do you know how the parametric parameters for that circle are calculated?
I am calculating solar eclipses and the circle is the edge where the rays of the sun's perimeter are tangential to the moon's surface.
https://www.geogebra.org/calculator/zaezs6qb
Thanks again.
Here is another version with a step-by-step contruction. It also allows for to place the center of the middle arc freely (not only on the edge of the cambal) and to set the angle freely. Thanks to /u/fm_31 for the ingenius idea using the homothety center for the construction.
Feel free to play around and see what kind of setup you might like. In principle you could add two specific conditions. Not sure if there are relevant physics-based conditions that should be prefered (e.g. low tension along the cut or some oscillation condition for better accoustic). From an asthetic point of view, maybe the arcs could all have the same radius. Or maybe even the same radius and same opeing angle. (Not sure yet how to construct that though.)
As for the implementation in GeoGebra, have a look how it was done. Most of the construction shuold be straight forward, but I also used a few auxiliary objects to not clutter the visuals too much. Feel free to ask if you don't understand something.
I guess you're using the Graphing Calculator. Use Suite or Classic instead. For a comparason of the apps see https://www.geogebra.org/m/vd6UC685#material/shfwqcpr
chris
The best software depends on what you need exactly, but for high school coursework, I'd just use screenshots of Desmos, or potentially Geogebra, projects. You can directly paste the image files into your document.
Desmos is by far the quickest and most user-friendly option. Conversely, Geogebra has more functionality in cases such as graphing sets of points, 3D graphing, and objects that aren't explicitly defined (e.g., where a curve meets a line) but is somewhat clunkier to use.
For future reference, if you wanted to use something even more powerful, for sleeker and more professional figures, you could use Matplotlib with Python, but this would be overkill for a high school application and probably a waste of time given its steep learning curve.
Generally speaking every point of armor negates one point of damage. There's some scaling going on against very low hits as well as when you go beyond reducing damage by 50% from an enemy (above 50% diminishing returns start kicking in).
As far as the actual effectiveness goes of upgrading armor it's kinda hard to say. Best thing you can do to gauge if going for fully upgraded armor is worth it or not is using this calculator and looking at the damage values of the different mobs out there to see if the damage mitigated between fully upgraded and not is worth it. The percentage amount of damage mitigated varies between monsters, ranging from 26-28%~ against non-star fulings and weaker mobs with a full lvl 4 set of armor vs lvl 1, to 17.5%~ against 2 star fulings and mobs that do similar damage.
So the equation that you give has three variables: x, y, and ?. For ease of solving, we'll call the question mark z so that the 3 variables are x, y, and z. Since this is a three-variable problem, the solutions (yes, plural) can be represented by a graph in 3D space. This graph will look a bit like a diagonal trench, as seen here: https://www.geogebra.org/3d/gss7drzd
If you want a specific solution, we can make up values for two of the variables and solve for the third. For example, let x and y both be 1: 1+1+25=Z; 27=Z. So one specific solution would be (1, 1, 27), or x=1, y=1, z=27.
Enjoy.
I think this one might be good (not sure): https://www.geogebra.org/m/utcMvuUy
I hope it helps things sink in. Just make sure not to spiral out of control playing with it and forget to do practice problems -- your grade might end up in the complex plane :).
Your work on simplifying expressions reminds me that I should not rely only on the solutions provided by CAS, thank you very much.
In fact, I am trying to get the value of θ when f(θ) is 0 when f(π/2) doesn't exist.
I was trying to animate a small ball rolling up a slidable circular surface, and I used CAS to get the solution to the system of equations, without bothering to simplify it. I think I'm halfway done, But it may take a few minutes to run because of the large amount of calculations.
Locus equation is created with an internal list of geometrical objects. it avoids "personal objects with own numbers". You can not create objects with xAxis for instead. You must create all objects with tool (avoid the commands and typing (x-2)^2+y^2=4 etc.)
I advise hide the axis (two lines is enough), hide the grid, avoid typing etc. only points and tool in menu. Then, when the locusequation() is OK put the lines in the axis and avoid its selection
​
In case that description wasn't clear, I made the construction for you.
https://www.geogebra.org/geometry/zjbjewcs
I used two circles of a larger radius than the half distance between them at points A and B, and the line that connects their intersections is a bisector of the secant connecting Points A and B. This then gives you the right triangle construction referred above. Once you have the length x/2 and y, you get the radius using the previous formula.