
What is Reddit's opinion of
CanvasJS Charts?
From 3.5 billion Reddit comments
➔ CanvasJS Charts website
By popularity on Reddit, this Service is:
16 reviews of this app found across Reddit:
We use Hubspot and pretty much works for our requirements at CanvasJS
You need to feed a lot of data(either automate or manual) to make the most out of it. Good to use a single platform for CRM, Sales, Marketing & Service. They recently upgraded the number of custom reports and dashboards you can create.
Not everybody is a native speaker. I didn't get this joke as well. I always thought of something like this.
The data was captured from a micro-controller I made that posts data to a Raspberry Pi 4 running InlfuxDB, Node-red, and Grafana(black graph). The data (in the white graph) is displayed using Canvasjs.com. (Note: I have two monitors so I cropped and pasted the graphs over the top of each other)
To make the prediction shown in the white graph, I take local weather data from darksky.net for temperature and the UV index. This is then fed through my simulator with the initial inside temperature as a starting point. It then calculates heat transfer from the roof insulation, exterior wall insulation, and ceiling insulation to find the delta temperature for every 30 seconds. It also takes into account the wall I share with my neighbor (I live in a duplex). For the most part the prediction is within 5 to 20 minutes of the actual runtime. The main reason I made this was to utilize the otherwise useless information I learned in my physics classes in college and to help me better pick a furnace schedule that would help minimize runtime. If you leave the home for 12 or less hours, turning the thermostat down actually makes it run longer. It's easier for it to maintain a temperature. I also made my homemade smart thermostat automatically turn down the temperature to 55 if it hasn't seen anyone in 18 hours.
My go to library for Charts is Nivo Rocks , easy to implement , stable and good looking. Depending on what you are exactly looking for CanvasJs is a good alternative, but not as clean looking in my opinion.
Start here for the API -https://riptutorial.com/node-js/example/9534/json-api-with-expressjs
Here for the chart - https://canvasjs.com/docs/charts/how-to/javascript-charts-from-json-data-api-and-ajax/
We have several job openings at CanvasJS
Anyone interested can find job descriptions and apply from https://angel.co/company/canvasjs/jobs
We just released beta version of CanvasJS StockChart Library this week.
StockChart is an advanced version of Chart with features like slider, range selector, synchronizing toolTip & crosshair across multiple charts, etc. It also comes with a jQuery plugin & React Wrapper.
Would love to hear your feedback.
I'm making a project in ReactJS that uses CanvasJS for pie charts. I'm trying to use Flexbox to render pie charts side-by-side (which should be relatively simple) but I've been having trouble for the past couple of days.
It's been very frustrating because I was making good progress on my project before just being absolutely stumped by this. I have detailed the problem more on here: https://stackoverflow.com/questions/62239138/canvasjs-charts-take-up-entire-row-when-using-flexbox
If anyone could help me solve this, I will gladly compensate you for your time!
It'd be good to round up/down numbers like these: 6,0191, 5,9922, or just show the first 2 decimals.
I'd be nice at some point to create a line chart with the ratings players have gotten and see, for example, which players have improved over time, stagnated, receded, etc.
Inbound always works better.
At CanvasJS, SEO and live chat constitutes key inbound strategy. Being a developer tool the website experience is optimised for developers with more code examples.
You increase the search volume by ranking for different keywords. For example we created content for integrations with different technologies which gets ranked for keywords like "react charts", "angular charts" etc.
We use Hubspot for nurturing the inbound leads.
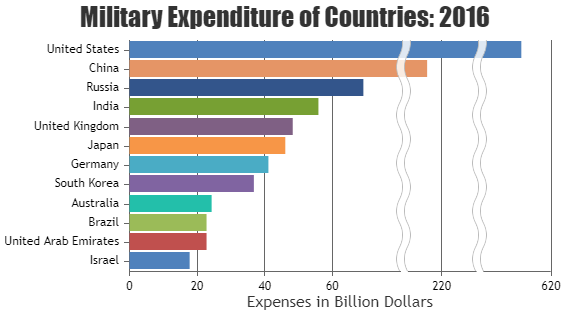
It depends what you want to show.
If the difference between the biggest value and the others is most important, go with what you have.
If the variation between the smaller ones is most important, just show those values on an appropriate axis. You could include the bigger one with a clear discontinuity marking - something like this - but it's visually misleading so I wouldn't recommend it.
If you need to show both, then you might just have to use two charts. If space is at a premium for some reason you could include the second one as an inset into the one you already have, since there's a bunch of space there, but it'll look better as two separate charts.
Looks like CanvasJS is free for students, see the "Free & Discounted Licenses" section on their license page. I wouldn't say it's common to have a "trial" or even require payment to use a library for web dev. Most libraries are open source and free, although you aren't guaranteed support or updates from the creator.
Hi, I'm working on a (school) project for which I have to design a webpage in which data from an SQL database is shown. This all works, but they also want a page which creates graphs based on the selected data. I did this now by doing some google searches using CanvasJS. But today I noticed there is a little watermark saying "trial version". Now I noticed that indeed when I surf to the CanvasJS website there are subscriptions and such there. But I do not understand how this works. Will my graphs just suddenly stop working after 30 days? How do they stop you from using them? Isn't all the info stored locally? How do they track it? I didn't have to create any account or what so ever to use this? I just need to know this because I have to put a lot of effort into coding all these graphs so it wouldn't be very helpfull if all of them dissapeared in a month :p. I'm using Visual studio, creating a c# asp.net MVC application. Any info would be welcome! Edit: This is probably the line of code that enables me to use canvasJS: <script src="https://canvasjs.com/assets/script/canvasjs.min.js"></script>. So does that just stop working after 30 days? (Webdev is pretty new to me, so I'm not experienced enough to know how these "libraries" work)
if you're just feeding data into a dynamic chart you could probably start with googling 'dynamic .js charts' and go from there.
surely there must be someone in a lab full of scientists with basic web development skills, i mean who set up the data computer?
doesn't sound like rocket science anyway. think you should be good with this - with a little help.
pre-built dynamic updating charts are a thing anyways.
https://canvasjs.com/html5-javascript-dynamic-chart/ - hopefully helps for a start.
It's possible to make dynamically-updating charts using Javascript, such as here.
But to do that, you'll need to know how to program using Javascript. If you're a complete beginner to web development (or programming), it'll take a while for you to learn.
I'm not sure of the best way of doing what you're trying to do. But my approach would be to create a Node.js app that runs your experiment (using 'python-shell' if it was in Python, for example) and logs the results to a webpage using socket.io. You can parse the value of stdout as your experiment is running, convert it into JSON, and append it to the graph in a similar manner to the above. Your experiment would need to run on the same server as your web application, but it would probably be a lot easier than trying to set up a server for your experiment and another one for your web app.
There'll be a pretty steep learning curve between learning basic Javascript and building the aforementioned node.js app, but I think it might be the easiest way to do it.
Cool, thanks! If I had more time I'd play with this canvas.js graph plug in - I think it could be brilliant for putting all the data into a single chart and then filtering on species, move etc. https://canvasjs.com/html5-javascript-line-chart/