
What is Reddit's opinion of
RStudio?
From 3.5 billion Reddit comments
100 reviews of this app found across Reddit:
If you are majoring in a subject that requires using a lot of statistics and possibly complex statistics (like in ecology) I recommend R, RStudio or any other variation of R. R is a lot of script writing and can get a little confusing but it is rather powerful. RStudio is a much more user friendly version of R. There are a lot of online resources to help teach you how to use it. There are packages to download which range from simply giving you a pre-scripted formulas to providing you with an entire GUI to work in.
Going into an undergrad you might not need to use it for a while and can get away with just excel, but once you get into the upper years a good statistical program will save you a lot of time and headaches.
The book R for Data Science is really excellent and available free in an easy-to-navigate online form. I highly, highly recommend it.
And although I don't know Python, I think that starting with R is a good idea, especially if this will be extra-curricular. The language is made for data science specifically, and has a really great associated user interface via R-Studio.
I must be the only data /analytics person on this thread because R-Studio is a very different software in my mind.
So I'm sitting here thinking of that R-Studio and wondering "is this a joke?" Or is there some crazy module in R-Studio that I don't know about...
For folks new to shiny on my team, I recommend the first section of mastering shiny (4 or 5 Chapters) and then watching both parts of Joe Cheng’s shiny dev conf talk on reactivity.
https://www.rstudio.com/resources/shiny-dev-con/reactivity-pt-1-joe-cheng/
You'll probably have to be at least somewhat familiar with the R programming language.
R is free and open source and can be installed here for most operating systems. You might also want RStudio to make coding in R a bit easier.
Once you have R, you can install the remotes package and use the install_github() function to install my package!
# install.packages("remotes") remotes::install_github("kiernann/fflr")
Once fflr is installed, you can library(fflr) and start calling functions using your unique leagueId to get fantasy data.
There are good 'cheat sheets' available out there on some R packages.
These, I've found, are a good way to eliminate some of the noise of Stack Overflow, and help get you where you need to be.
Though, part of the beauty of R is that there are so many ways to go about coming to the same ending point. Use what you are most comfortable using and understand.
It also wouldn't hurt to over-annotate your code with comments, especially when starting out. One month from now you will really appreciate the comments you put in your code now when you need to figure out how the hell you got the code to work before!
> And about the software itself, is it freeware?
Yes
> Where would be the best place to get the software?
But I'd also advise getting R studio https://www.rstudio.com/
https://www.rstudio.com/products/rstudio/download/
Follow the instructions. R first, then R Studio.
Your situations far from ideal but you're not really in trouble until you bomb the first midterm. Make sure you crush the first midterm and regularly attend office hours from here on out and you can catch up
Found this sub a while back, and decided to give it a shot with RStudio! Filled up a contact form here and they sent them over free of charge https://www.rstudio.com/about/contact-sales/ I love the R community :'-)
Take a look at the Data Wrangling Cheatsheet section on reshaping data with tidr. gather() should get you the result you’re looking for more or less.
Oh boy, I have tons of advice!
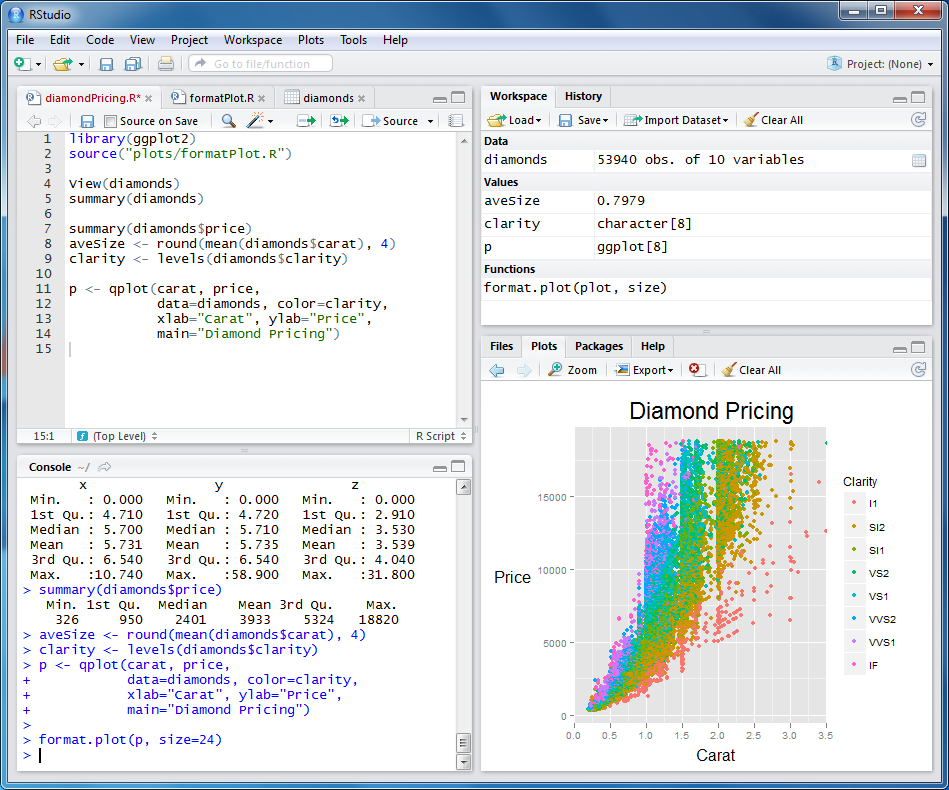
1) Download RStudio, which will make the UI so much more friendly. Having your working script, console, fast access to all the variables currently loaded in memory, and an area for plots (and also fast downloading of new packages!) makes it night and day.
2) There is a package for EVERYTHING. Luckily in R, most of the things you want to do, you don't have to figure out how to do yourself. There are so many packages that are really easy to use and well-documented, all you need to do is find the right one, check the usage, and bam!
3) If plotting is your aim, ggplot2 is the package for you. That's the main go-to in terms of plot customization options, and you have control over basically every aspect of your plots. There are tons of tutorials that'll walk you through every aspect of ggplot as well!
4) If you use Windows as your OS, install to C:/ NOT Program Files. Installing to Program Files will make some packages unable to be compiled through the devtools (if you use any packages that need to be compiled) because of the space in the name.
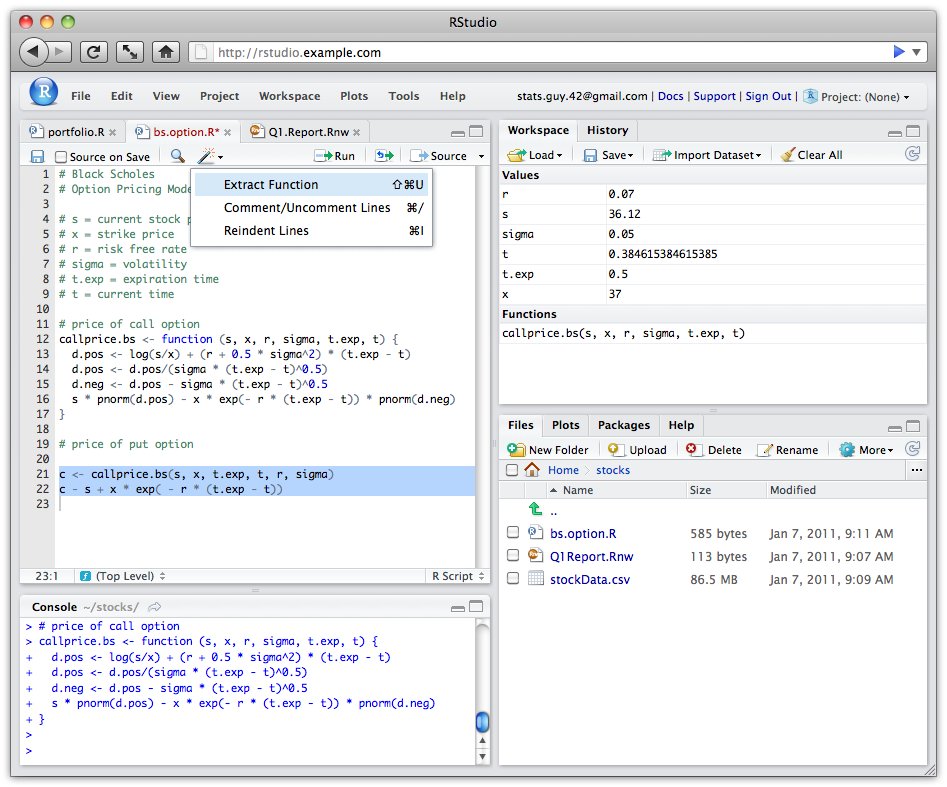
Edit: Took my real name out of the screenshot.
Here's a free R bootcamp that introduces the tidyverse set of packages that makes data science easier for beginners: https://r-bootcamp.netlify.com/
Trouble remembering? You can always refer to cheatsheets: https://www.rstudio.com/resources/cheatsheets/
I recommend using rstudio. It shows the list of functions as you start typing, so it becomes easier to code if you remember just part of a function name.
It's free open source software that you can download and install on virtually any machine.
​
The R Studio website is a good beginning. They have a lot of resources on there that is useful.
Then R for Data Science is a very good place to start.
DataCamp also have very good tutorials.
There is a lot of other resources but this is a good beginning.
there is a cheatsheet:
https://www.rstudio.com/wp-content/uploads/2015/03/ggplot2-cheatsheet.pdf
If you're after a GUI tool go use graph pad prism. The whole point of ggplot is to program. Also you can create a list object with aesthetic arguments you can import and apply for ever graph if you want them to look consistent.
No need for a loop here. dplyr makes things like this easy once you know how to use it.
library(dplyr) df %>% filter(set != 'NA') %>% # get rid of NA sets group_by(set) %>% # dplyr will group the sets for you summarise(meanER = mean(PowerER, na.rm = T), meanEL = mean(PowerEL, na.rm = T))
I didn't test this, but it's at least pretty close.
I started with R before picking up MATLAB. You'll want to get R Studio. It will give you an IDE similar to MATLAB. Alternatively check Octave (/r/octave). It's basically open source MATLAB.
here are the mind blowers: package:dplyr, package:tidyr, package:sqldf, package:ggplot2 package:rvest (with selector gadget) package:data.table
here is a quick primer on why dplyr and tidyr will make you WAY more efficient if you get data from clients or customers in weird formats:
https://www.rstudio.com/wp-content/uploads/2015/02/data-wrangling-cheatsheet.pdf
some of this CAN be done in excel it's just that writing code is a little easier in R (imho) and you can get much better data visualizations
if you have any questions on how to do something specific in R that you have been doing in excel I would be happy to help, and of course there is always /r/rstats
Sounds like you want a Shiny app. Check out shiny server pro for handling many concurrent users. https://www.rstudio.com/products/shiny-server-pro/. I don’t think you’d need a paid version or R itself tho.
Absolutely! You could use R, Python, JavaScript, and I am sure there are more.
I used R because I use for my work and it is the language I know best. It is open source and can be downloaded for free here for Windows, Linux and MacOS. The interface recommended for easy use is called RStudio, and can be downloaded here. The package I used to perform this analysis is a compilation of many separate package all about data manipulation and plotting. Within the R console you simply need to type
install.packages("tidyverse")
and R will do the rest. The script to make this analysis is on my github page. Running that script should reproduce the figure I have posted. The code on line 36 through 38 says which legal moves the knight can make (i.e. 2 up and 1 down, or 1 down and 2 up) for a total of 8. You can try to change the 2s into 3s and see what happens. You may need to change the number steps (line 30) to a bigger value, or increase the dimensions of the matrix (line 27).
This may sound very daunting at first, but the only way to learn how to code is by doing, trying and playing around. I liken it to learning mathematics or another language. Good luck, and I would love to see whether any knight always gets stuck!
If you have any more questions I'd be happy to answer.
You're welcome.
Here's the cheat sheet for the dplyr package, it will help a ton.
Good luck with that professor, you'll need it.
First, cool, enjoy R. Then you should try with dplyr, is very straight forward for what you want.
library(dplyr) merge.data <- inner_join(ds1,ds2,by="codeid")
Nice cheatsheet https://www.rstudio.com/wp-content/uploads/2015/02/data-wrangling-cheatsheet.pdf
I have 2 recommendations:
Use rStudio. It is a front end to r that is, Imo easier to use in general. It can be downloaded here
When you download r, use swirl. It is a tutorial directly in r that helps teach the basics. It can be run by typing the commands
> install.packages("swirl")
> library("swirl")
> swirl()
Good luck with your adventures!
/u/zdk and /u/BeerSharkBot covered how to solve your particular problem, but for general data cleaning and manipulation work involving character strings I've found the stringr package extremely useful. The "Working With Strings" cheat sheet from RStudio is a handy two-page pdf to use as a quick resource. On the first page it lists a quick summary of the useful functions in the package, and on the other it gives a nice breakdown of regular expressions with examples. The package page also has two vignettes (linked on the page): "Introduction to stringr" and "Regular expressions". Those will go into more detail than the cheat sheet does if you want to learn more.
I would recommend looking at R. It sounds like you could very quickly glean this information with a R data frame. R Studio is an amazing open source IDE for working with the language.
JMP is also a common tool used in many industries for statistical analysis with large datasets. But the license fee is hefty. I have been using this for 15 years now for my work, but I am shifting to R as I am starting to develop more server side components.
Good luck.
Excel (Google Sheets to an extent, I've found charts easier to work with in Excel) is very useful. It does load quicker on Windows than OS X.
Python and R are free, open source programming languages that can be pretty powerful. There is a lot of documentation and plugins and packages for applying these to different science disciplines. I highly recommend R Studio. If you wind up using big datasets, or want to make graphs exactly how you want them, one of these two will do you wonders.
GIS would be useful to be familiar with. Take a class on it, because the software for it (ArcGIS/Map/Scene, QGIS (free), Grass (free)) are not terribly intuitive. Figure out how to do some basic stuff like making maps, importing data from different sources (like LIDAR data, so cool!). There are python plugins for ArcMap, so all the more reason to be familiar with python.
For what it's worth, undergrad used Excel most of the time. There were usages of other programs like SedLog and Georose (which now has a Mac version).
No, because my role at RStudio is to make R awesome 😄 I have no direct responsibility to make money for RStudio, except that if R is more useful, more people will use it, and so more people will use RStudio and then more people will buy our commercial products.
I use C and a library called libsvm when working with support vector machines. For everything else I use RStudio.
I’m not familiar with investing software so I might be totally off here. But maybe it’s the stats / data science software “R” which is certainly flexible and strong enough for your purposes. It’s also free so many profs teach it in my experience. Here: RStudio (the most popular IDE for R) .
You can combine plumber and future to make an asynchronous web API. You just wrap the logic of your function with future()
library(plumber) library(future)
#' @get /my/route function() { future::future({ my_route_function() }) }
Here's a little resource on that as well: https://www.rstudio.com/resources/rstudioglobal-2021/plumber-and-future-async-web-apis/
If you want to do this on unbuntu. you "just" need to open the terminal app.
install R
open the terminal
then paste the command :
sudo apt update sudo apt install r-base
you will be asked to provide your password.
Those command request the Ubuntu repositories ( Ubuntu app store) to :
- get the latest list of app
- install R
You could also just open the ubuntu app store via the graphical interface and search for r-base
But this is the first step. I assume that you would like to have a graphical interface to run your scripts. The most common one is Rstudio , which you can also install on windows.
install Rstudio
In your situation you can do the following , still in the terminal app you paste :
sudo apt install wget wget https://download1.rstudio.org/desktop/bionic/amd64/rstudio-1.4.1106-amd64.deb sudo apt install ./rstudio-1.4.1106-amd64.deb rm rstudio-1.4.1106-amd64.deb
the reason you have to do this is because Rstudio is not available in the Ubuntu store. What happens is
- install a little utility to download things from the internet (it might be installed already)
- you ask the utility to download the latest Rstudio which you can verify here :https://www.rstudio.com/products/rstudio/download/
- you install Rstudio (.deb is the ubuntu .exe)
- remove the uneeded .deb
Don’t have time to Skype unfortunately but can recommend the package dpylr. It’s very straight forward compared to other methods. The cheat sheet found here is also very helpful. Good luck
With the RStudio 1.2 preview release, you can finally add new color schemes without having to edit the horribly-named CSS files.
You can use an online theme editor like this one, modify until you're happy, then add the theme file through the RStudio global options. If you're using RStudio server, you'll need to upload it to the host, first. I also had to add an extra blank line at the bottom of the .tmtheme file to make it happy.
I could be mistaken, but this might be what you're trying to get at
library("dplyr") df.join <- left_join(df1, df2, by = "Code")
A loop might be overthinking it.
Also, to take dplyr a step further, you might try using pipes like another commentator suggested.
library("dplyr") df.join <- df.1 %>% left_join(df2, by = "Code")
With pipes, you can chain a bunch of commands together in a series of easy to follow steps that will lead to a result. It helps to eliminate intermediary steps that clog up computer resources and are hard to mentally keep track of.
PS: Far be it from me to comment on your code, but using a mix of caps and lower case and also spaces could cause you to tear your hair out. Speaking from personal experience.
PPS: I heart this: https://www.rstudio.com/wp-content/uploads/2015/02/data-wrangling-cheatsheet.pdf
Additional R and RStudio cheat sheets.
Looks like the "Advanced R Cheat Sheet" is the one produced by RStudio so that one is a duplicate.
It would be an Amazon cloud server running rstudio-server, which gives you (slightly dumbed down) persistent R Studio sessions in a web browser. We could share scripts and data etc.
> While shiny is great, we don't want to rely on its hosting service for a number of reasons and want to keep everything coded in a webpage.
You don't have to rely on shiny hosting, you can download the Open Source Shiny Server and host it yourself. Would probably help to have the assistance of someone familiar with GNU/Linux systems and setting such things up if you're not familiar with them.
Hey, Ian from RStudio here. I'd recommend asking your professor if the school can set up a RStudio Server for all the students to use. If your class is using RStudio for teaching purposes, you can even ask your professor to contact us and we can hook them up with a free academic license for RStudio Server Pro (which will be easier for them/the school's IT dept to manage).
Thought you were talking about the IDE for the R programming language (which is also called R Studio), and was very confused.
I can't really help you with drive data analysis, but in case you want to get into statistics, here is the link to the other R Studio: https://www.rstudio.com/ 😅
I would also suggest taking a look at the IDE for R called "RStudio". It will make installing packages, viewing results, help searching for arguments and script management much, much, easier. RStudio also has great cheatsheets for different packages.
You're right to store data in the long format for plotting in ggplot2, and you're on the right track with your ggplot code. In regards to A, you can use the color and shape aesthetics in the geom_line call to change the color and shape of the lines, respectively.
In regards to B, try data$week <- factor(data$week, levels = paste0("W", 1:12), ordered = TRUE) to change your week variable to an ordered factor so that it will plot correctly. Alternatively, if you don't want the "W" in your x-axis labels and would prefer just to have the numbers, data$week <- as.numeric(gsub("W", "", data$week)) will remove the W and convert week to numeric, which will plot in order as well.
There are lots of places online to find help on ggplot2, but you're on the right track - this cheat sheet might be good for quick reference, and you can usually find questions similar to your own on stack overflow.
Check out the “combine datasets” section of this data wrangling cheat sheet. This should provide you with a way to join the data depending on how you’d like the end state to look.
https://www.rstudio.com/wp-content/uploads/2015/02/data-wrangling-cheatsheet.pdf
Ps. I always keep printed versions of the cheat sheets on my desk and it’s saved me a LOT of time
Like u/Stevefitz says, R's big limitation is memory managment. That said, unless you're working in the big data sphere (tens of millions of observations plus) it shouldn't be a problem. In cases where memory is an issue, I've found the data.table package to be indispensable. When that fails, turn to Python.
Like you, I transitioned from compiling basic excel reports with hacked together VBA scripts to building interesting business intelligence analyses using R. The VBA portion illuminated untapped potential to the decision makers; the R skillset enabled fulfilling that potential. Once you get the hang of using R or Python, you realize that both can do what VBA does but better and faster.
If you do end up going down the R route, checkout the RStudio and the Tidyverse. I thoroughly enjoyed DataCamp and convinced my employer to pay for it. They teach Python and R.
> my first programming language
It's kinda of a hybrid. There are GUI front-ends that make it a bit less programing and a bit more spreadsheet-like. R-Studio is probably the best. Although if you want to re-run a scenario multiple times, you'll end up writing scripts/programs.
/u/lionbutt_iii probably has a good idea that taking some classes would probably help as there is a bit of a paradigm shift from spreadsheets to R.
well you can't find them back unless you use data recovery software.
I always delete with shift-del so that it doesn't go to the thrash can (be careful as you can sometimes delete something that you didn't need to delete)
normally it gets deleted but the file will remain until a piece of the file gets over written on the Hard drive. so the smaller the hard drive is the faster it gets overwritten (in theory) as the file is just marked as free space.
if you want to throw away a hdd or something it's always recommended to boot and nuke (just writing 0's all over the hdd so everything is lost forever)
I Personally use R-studio for recovery (mostly for friends as I make backups myself haha)
and never throw away old hdd's sometimes you are lucky when a hdd breaks down you can change the chip on the back. if its the same product / serial number range.
Good advice above, responding with the link to the free version published online by the author: http://r4ds.had.co.nz/
+1 for the tidyverse. OP, if I'm reading your post correctly, it sounds like main thing you're missing is how to correctly structure your data within R in order to run the regressions you want. Using a "tidy" structure (each row is an observation, each column is a variable) makes things much clearer.
Last recommended resource: RStudio's list of cheatsheets. It's got nice visual references for what several major commands do to the underlying data. When I was first starting out, it was very helpful for me to look at my dataframe, run one line of code, see how the data changed and so on.
I'm a huge fan of Hadley Wickam's tidyverse family of packages. It provides a really nice and consistent way to work with dataframes that is (I think) much more straightforward and easily scalable than the base r methodologies.
He's got a great book that is available online for free which covers everything really well. It can be found at http://r4ds.had.co.nz
In this case the function would be mutate, which will create a new column from other ones.
The cheat sheets at rstudio are also an amazing resource, like this one for this kind of thing. https://www.rstudio.com/wp-content/uploads/2015/02/data-wrangling-cheatsheet.pdf
Try it. You probably can’t run the latest RStudio version on Windows 7 — the RStudio download page has a list of older versions with annotations. You might want to try version 1.1.463 for 32 bit.
R itself should work, according to their FAQ.
That being said, you should upgrade your OS. Windows 7 is obsolete and unmaintained. You do not want to use it, except to maintain legacy systems, and even then only until 2023, which is when Microsoft will stop providing yearly security fixes for it.
You can do this just adding a second term in summarize, as u/RookWV already said. In cases where you really need to combine different data based in a specific variable, you should use: inner_join(first_dataframe, second_dataframe, by = common_Variable). There are other possibilities too, like left_join, right_join and full_join. Take a look: https://www.rstudio.com/wp-content/uploads/2015/02/data-wrangling-cheatsheet.pdf
It took me a month of practicing every day (5 hours a day, as part of my internship). After this month and after reading many stackoverflow posts, I was able to automate the production of an specific graph (an age pyramid) for any city in my country. In addition to the books already recommended, I found very useful the cheat sheets that you can download here: https://www.rstudio.com/resources/cheatsheets/
Good luck!
Specifically from the R Studio website, their cheat sheets are a great resource for beginners in visualizing the functionality of some packages, including tidyverse. (https://www.rstudio.com/resources/cheatsheets/)
You can work with professors for research opportunities if you're solely seeking research. As far as stats go, tools like R (open source), Gretl/Stata (if you're more of a point and click person) and Python (pandas) are really powerful for statistical analysis.
Edit: If you do end up using R, there's a package you can install called swirl that's very beginner friendly and it's interactive with the console from RStudio (don't forget to download R itself first).
Is there a key that is connecting all the observations somehow? To do something like this, I generally use joins from dplyr and subset with brackets if nec. Do you use dplyr at all? There's a great cheatsheet online: https://www.rstudio.com/wp-content/uploads/2015/02/data-wrangling-cheatsheet.pdf
edit: Actually, I might be misreading you. Are you trying to add more observations from the other data sets to the master only? So the variables of interest exist in all data sets?
In that case, I suggest you begin by making your way through this online, interactive stats book:
http://onlinestatbook.com/2/index.html
If you prefer to work offline, there is a PDF version freely available on that same site. If/When you are comfortable with all of the material in that online book, I HIGHLY encourage you to become acquainted with R. To put it bluntly, R is the gold standard of statistical software. It is opensource and the amount of community support available for anyone learning to use it is amazing. Most people using R also use an interface for it, which must be downloaded separately. I prefer RStudio, but it really doesn't matter which one you use as long as you are comfortable with it.
R Project (software and info): https://www.r-project.org/
RStudio: https://www.rstudio.com/
If you have any other questions about resources or career prospects, I will be happy to help. I certainly don't know everything, but I am a member of the American Statistical Association so I have access to some sweet stuff that can help you.
If this is a one time thing, meotai's suggestion should work. But if you're planning to use R on a regular basis to do analysis, you should probably take the time to do a tutorial to cover the basics.
# installs dplyr if (!require ("dplyr")) install.packages("dplyr", dependencies=T) # takes the data, splits into smokers and nonsmokers, # counts records in each category data %>% group_by(smoker) %>% summarise(n())
Edit: reddit code formatting and missing parentheses.
Since you've programmed before, I recommend looking at these links:
This site focuses on the statistical analysis specifically regression: (good place to start) r-statistics
This site better explains what each function does in R. stat methods
Also, I highly recommend using Rstudio when coding (its an IDE) and reading their cheat sheets cheatsheets
Google and blogs are your best friends.
RStudio already is browser based. You'll need a rStudio server to connect to though. https://www.rstudio.com/products/rstudio/#Server . You could rent an online server and set it up on that, perhaps shared with the other students?
ELI5 is kinda tough. There is a reason people are getting paid well to do this and it's not because it is easy. How about ELI18 who took honors math in HS?
First, subscribe to /r/machinelearning. It is consistently one of the best subs on reddit.
Second, I have heard good things about this cousera course. Andrew Ng, the guy who teaches it, is a total baller.
Third, get an intro to R book off Amazon and teach yourself R. R studio runs great on a mac.
Student here; python & R are both open software, so is very easy to share and reproduce results using these languages, unlike matlab. You can use tools like Google Colab to run R or python code anywhere (with a gmail account), for example.
In terms of difficulty I'd say the three are begginer-friendly, and all of them have nice integrated development environment (IDE) options (e.g. Spyder for python, Rstudio for R).
For me, python would be the most useful for his multiple uses and bigger community.
You're welcome :)
https://www.rstudio.com/wp-content/uploads/2015/03/ggplot2-cheatsheet.pdf
The + sign is unique to ggplot. But it also makes sense in that each component added to the graph is additive and layered in the order things are added (i.e. bottom up, like a cake).
It's a very powerful, completely free, open source software package for data analysis, manipulation, machine learning etc. It has its own language, but it's easy - I'm not from a computer science background and I find it very intuitive. The most accessible way to learn is to download RStudio:
install dplyr iris %>% select(Sepal.Length, Sepal.Width)
should get you your two columns :)
Check out the dplyr package, it's fairly commonly used for data analysis / wrangling. This cheat sheet is also a good guide: https://www.rstudio.com/wp-content/uploads/2015/02/data-wrangling-cheatsheet.pdf
Use geom_smooth() instead.
​
This should help:
https://www.rstudio.com/wp-content/uploads/2015/03/ggplot2-cheatsheet.pdf
This cheat sheet is amazing. There's a similar one for numpy, Matplotlib and seaborn as well.
Also, R users, there's a similar and equally amazing data wrangling cheat sheet on the official R Studio website. Here's the link for all their cheatsheets - https://www.rstudio.com/resources/cheatsheets/
Both of these cheat sheets are extremely useful while wrangling data.
R is a pretty easy language to learn on its own, in fact learning other languages may make it more difficult since R has quite different syntax from Python (which is the most common beginner language). You probably don't need comp sci courses for your job, since R is mostly used for data analysis and not algorithm design. I recommend downloading RStudio (it has a much more friendly user interface than other R IDEs) and the package swirl, which you can download by typing install.packages('swirl') and run with the command library(swirl). It's an R package that lets you learn R in the R environment, so you get comfortable with how RStudio feels and what everything will look like when you're actually doing your work.
RStudio is an IDE for the R language (https://www.rstudio.com/). It's one of the more popular IDEs for R actually so its not really obscure/new. I've been using it for the past few months with no issue except last night. I manage to reinstall it after the restart and MWB has not flagged it again.
> Were you doing anything specific when this happened?
I was running my program but it wasn't anything new and have been working on this particular file for over a week. I can still run it now fine without any issues. I created the file from scratch, it wasn't downloaded from any source.
Are you always extracting numbers out? If so, this code works.
library(tidyverse) df <- df %>% # Extract number into new column mutate(replicate = str_extract(identifier, "\d")) %>% # Replace numbers with empty string, then trim extra spaces at end of string mutate(identifier = str_trim(str_replace(identifier, "\d", ""))) %>% # Rename identifier column rename(name = identifier)
But to answer your question specifically, you're looking for the function ifelse().
library(tidyverse) df <- df %>% # If type == "unkn" then extract the number, otherwise make the value NA mutate(replicate = ifelse(type == "unkn", yes = str_extract(identifier, "\d"), no = NA)) %>% # Replace numbers with empty string, then trim extra spaces at end of string mutate(identifier = str_trim(str_replace(identifier, "\d", ""))) %>% # Rename identifier column rename(name = identifier)
The second one works, but technically ifelse() isn't necessary if you're always extracting numbers. Up to you which one you need. In either case str_extract uses things called "regular expressions". There are cheat sheets for the package stringr and regular expressions in general here.
If you have any questions let me know, happy to help.
I've been teaching myself the open source statistical programming language R for a while now. The development environment Rstudio supports fairly easily Rmarkdown documents. So, I used a variety of standard R packages, including ggplot2, to make the plots.
I got the data in .csv format from Baseball Reference and fangraphs, and used the read_csv library to pull the data from the file into what R calls a data frame. Once loaded in a data frame, I can alter and manipulate it in a variety of ways, computing additional stats into new columns, etc.
I used features/packages called Rmarkdown and Shiny to create the HTML page with embedded interactive plots. This web page was the key in going from static Rmarkdown documents to the interactive plots.
It seems like your question about how apply() is working was already answered in the comments, but I thought this code might be 'more straightforward' for what you're trying to accomplish.
R1Data<-myDF[myDF[3]!=0,]
Also, if you're wanting to learn dplyr/plyr/tidyr syntax, R studio has a list of common 'cheat sheets'. There's also this one which doesn't appear to be on their list anymore, but covers common functions for managing/transforming data!
I would suggest pirating SPSS, but if you're not comfortable doing that, you can do most basic-level stats in excel. Do some quick googling about how to execute specific tests. And for anything more complicated that cant easily be done in excel, download R and RStudio which are open-source command-line level programs for statistics. I've included links below. R is harder to get used to than excel if you are unfamiliar with how programming languages work, but ultimately its more powerful and versatile than either SPSS or excel.
I would suggest using Rstudio (https://www.rstudio.com) as an IDE together with the package rcmdr (R commander), which provides a GUI for performing basic data analyses like linear regression, plotting variables etc. Take a look at their webpage http://www.rcommander.com.
And of course, have a look at the R blogger webpage (https://www.r-bloggers.com), they have great introductory articles for beginners.
Depends what you intend to do with it. I am also confused about the format of your data, but I'm assuming you'll want to merge the first and second rows into a single header row with descriptive variable names, and rearrange as needed. For example, if columns 2-3 are the same variables as columns 4-5, then cut them apart and bind columns [1,4,5] to the end of [1,2,3].
If you'll be working in R, have a look at the tidyr package (http://tidyr.tidyverse.org/) and this cheat sheet: https://www.rstudio.com/wp-content/uploads/2015/02/data-wrangling-cheatsheet.pdf
If you don't want to learn how to setup your own Linux server and install/configure ShinyServer yourself you might want to consider hosting it at www.shinyapps.io. Free for limited bandwidth across upto 5 sites, but if your site is going to see lots of traffic or you've more than 5 sites to host you'll likely hit the limits and want to upgrade.
I'm pretty sure you have no idea what you're getting into, but sure, learning is fun.
R is a statistical programming software that has many packages available. R studio is a more user-friendly interface for it. If you have any coding experience you shouldn't have too much trouble with it. It's open source and free.
Once you have that running you can install the "forecast" package, and try running the following code
library(forecast) x = c(0,2,2,0,1,1,1,0,3) # Comments # Put the rest of your data in there, I stopped early myts <- ts(x) fit <- arima(myts, order = c(1,1,1)) forecast(fit, 3) # end
That gives you the model's prediction for the next 3 observations, (under "Point Forecast"). It also gives confidence intervals for each of the observations.
You can change the values of c(1,1,1) to other numbers. There is a lot of theory that you're not going to be looking at, but you can try it out. (But please keep those numbers small, between 0 and 3 would be best). You can change the number in "forecast(fit, 3)" to other numbers if you want to look further ahead.
As I said before. This is probably not going to give you reliable results. These methods are not meant to be blindly used.
There are many other options that you can try out, but this can get you exploring without too much headache (I hope).
the answer to your question is the library/package dplyr
https://www.rstudio.com/wp-content/uploads/2015/02/data-wrangling-cheatsheet.pdf
It have SQL-like syntax like C# LINQ.
You should check out the tidyverse packages (packages that made for the tidyverse).
~~Henry Wickham.~~ edit/update:
Also look up Hadley Wickham. He's the most influential programmer in R as of now and most of his packages are often use including dplyr.
There is also the installer for Ubuntu and other Linux distro's on their webpage.
https://www.rstudio.com/products/rstudio/download/
Installers
RStudio 0.99.902 - Windows Vista/7/8/10 77.1 MB
RStudio 0.99.902 - Mac OS X 10.6+ (64-bit) 60 MB
RStudio 0.99.902 - Ubuntu 12.04+/Debian 8+ (32-bit)
RStudio 0.99.902 - Ubuntu 12.04+/Debian 8+ (64-bit)
RStudio 0.99.902 - Fedora 19+/RedHat 7+/openSUSE 13.1+ (32 bit)
RStudio 0.99.902 - Fedora 19+/RedHat 7+/openSUSE 13.1+ (64-bit)
Thank you!
All the workhorse functions and calculations are written in R and the app is written and produced with the 'shiny' package for R. The package creates the final HTML-js kinda web app.
Thank you for the offer for hosting! To host the app the server needs to be running a shiny server. I'm more of an end-user so I have no idea how to deploy that. Right now I'm focused on fixing any bugs that appear and seeing how much load this app is creating.
Will it be alright if I contact you again later regarding hosting? It will be a great to have a mirror site!
R is probably the best place to start. As /u/seriouswork says, the things you learn in R - how to use syntax, which tests to use when etc etc, can be easily carried over into SPSS without much difficulty (SPSS generally uses an easier graphical user interface whereas R is just code).
R also has the advantage of being completely free. You can download R and R Studio today and start fiddling around with it. There's a good free book aimed at psychology students called 'Learning Statistics with R' which you can download for free. Or if you want to spend money you might try Andy Field.
Also worth learning to use ggplot2, rather than the default graphing software, as the ggplot graphs look mighty fine.
Best of luck.
tidyr is actually pretty similar to reshape2, but it's been designed with use of pipes in mind (i.e. like the plyr to dplyr conversion).
If you know reshape2, you'll be able to switch to using tidyr just fine; the biggest difference is going to be specifying "key" and "value" instead of "variable.name" and "value.name" inside the function. It took me about 15 minutes to work out the differences once I'd figured out how to use dplyr and pipes. Now I don't think I'd ever go back.
Check out this blog entry and this cheat sheet for a pretty easy introduction. At least for me, it was harder to grasp the concept of "wide form" and "long form" (when learning reshape2) and much easier to make the transition from reshape2 to tidyr, as the concept stays the same and the only real change is syntax.
Try R studio if you want to go with R, it is much easier to use. Just find a couple of examples online and you will be good to go.
The best alternative probably is Stata, but I do not think that Stata produces nicer output (admittedly, you do have to program more in R to get the nice output). Also, Stata is not for free.
Bottom line; try R, using R studio, if you really do not like it, get something like Stata (or perhaps even SPSS). Don't bother with Matlab (similar coding requirements as R, not free and graphics are not that amazing out of the box), or mathematica.
If R is working for you and you want even some more freedom, go with Python / [Julia](www.julialang.org).
Haha unfortunately yes. R is part of my development environment for work and I think it is amazing. I recommend you grab R Studio to use as an IDE. It will help tremendously with getting started and is much less intimidating than just a command prompt. The R community is great and you will find tons of sample code online and in the documentation for every package.
PM me if you need any help.
the RStudio server is probably what you're referring to. the server let's you run pretty much all of RStudio in your web browser.
pic: http://www.rstudio.com/images/screenshots/rstudio-web.png
edit: if you register for the shiny beta you can have access to an rstudio server http://www.shinyapps.io/signup.html
Rainbow parentheses might be something you want to activate: https://www.rstudio.com/blog/rstudio-1-4-preview-rainbow-parentheses/
Seems like a silly thing but helps a lot to ensure everything is properly enclosed. For me it works better over a dark theme. Selecting a good theme I´m sure will help you a lot too.
Rstudio also has an autocomplete functions, which will surely help avoiding typos.
I guess you have obtained r studio packages from here. Try the solution below:
sudo apt update && sudo apt install libnss3 -y
If it asks something about old-stable accept it.
That's fine. Just use RStudio. Almost everyone uses it to run R.
https://www.rstudio.com/products/rstudio/download/
Get familiar with it and it will save you lots of headache in the future.
This cheatsheet doesn't contain ggplot because it only focuses on the most common functions that are easiest for beginners (such as base package plotting), but there is a handy cheatsheet especially made for ggplot at the top of the page here if this helps: https://www.rstudio.com/resources/cheatsheets/
If you want to run R on OSX, download this file for x64. If you have an ARM Mac (new M1 chip), download this file. After downloading, open and follow instructions. Once complete, download RStudio Desktop Open Source Edition. That RStudio is a nice IDE (editor) for R (language) scripts. You may need to provide disk access to save files and read directories.
You can process all kind of RR data. From activities, your own orthostatic test or a nights sleep.
Simply set it for Other indoor activity and record your in supine position for 3 minutes. Stand up and hold standing position for a few minutes and then stop the session Import the RR and choose the two sections for your own orthostatic analysis. :)
I recommend you to read up on the superb documentation and information about the application and how to parse the output.
If you really want to get into HRV analytics you can dive into rHRV and R-studio which is when it gets really fun.
vc mencionou que está usando o R Cloud, talvez porque tenha baixado do https://cloud.r-project.org/
Surigo tentar baixar também o R Studio. O R Studio é a interface gráfica que permite usar R com mais facilidade para rodar esses scripts
Note I am not a statistican but a biologist that uses statistics.
You have what is called a repeated measures design since you are taking measurements from the same people across multiple time periods. I'm not sure if you know how to use R statistical software but this would be relatively easy to do in R which is free. If you have never used R, Rstudio is a must as well
This would be a linear mixed effects model assuming your response variable CCT is a continuous value. You have a fixed effect of year and a random effect of individual id For simplicity, a linear mixed effects model is very much similar to a paired t-test depending on how you specify it.
To do this model in R you would run the following code
install.packages("lme4") install.packages("lmerTest") library(lme4) library(lmerTest)
data <- read.csv("/Path/to/your/file.csv")
data$year <- as.factor(data$year)
model <- lmer(CCT ~ year + (1|id), data = data)
summary(model)
Replace id with whatever you column name you use to keep track of the identity of your individuals and replace year with whatever column name you use to specify the year. Replace CCT with whatever column name you used to specify central corneal thickness.
This should output a summary of the model output where you will see the estimate of your effect of the variable year and whether it is significant (the p value) under the Pr(>|t|).
If you end up using R and run this let me know if it doesn't work and I can try and help some more.
Using the "tidyverse" package of functions:
data %>% group_by(Governorate) %>% count() %>%
ggplot(aes(x = ??, y = ??) + geom_????
That will group all your observations by their Governorate and count how many in each. I don't want to do all of it for you because I want you to learn. Here is the "cheat sheet" for ggplot. Try to figure it out from there.
Try https://swirlstats.com, it is a bit more interactive if you aren't the type to pick up a coding book and work your way through it.
RStudio can also help to be able to visualize what you are working on. https://www.rstudio.com
Let this answer serve all of those who asked the same question:
install R: make sure you get R version 3.5.3. Apparently this library doesn't like anything else. I tried both 3.6.0 and 3.5.0 with dismal results. https://cran.r-project.org/src/base/R-3
(Optional) Install RStudio. I like using this as an editor because it helps me keep things tidier.
https://www.rstudio.com/products/rstudio/download/Run this code: https://www.reddit.com/r/nfl/comments/bxhlbl/best_protected_qbs_in_2018/eq6rr9e?utm_source=share&utm_medium=web2x
I'll let u/cDidsM answer about their code, but here's a good resource for this stuff: Data Wrangling Cheatsheet.
Funny, my first code chunk was incorrect per your original question, but then turned out to be what you actually wanted!