
What is Reddit's opinion of
SageMath?
From 3.5 billion Reddit comments
➔ SageMath website
By popularity on Reddit, this Service is:
27 reviews of this app found across Reddit:
Hi,
Just a few hours ago Léo Ducas uploaded a Sage project for testing the claim:
It's using the FPLLL lattice reduction library.
As others have suggested, for writing computer science (and mathematics, for that matter), LaTeX is really the way to go.
Sage is a computer algebra system that not only provides a lot of functionality of its own, but also ties together many specialised open source projects, including Octave and Maxima that others mentioned, with a uniform Python interface. You can use it to write Jupyter notebooks: interactive documents that combine text (which supports Markdown and MathJax), code and plots. You can also integrate it in your LaTeX documents with SageTeX, which allows you to include the output of blocks of Sage code in your LaTeX document.
I can't claim it's the path everyone should take. It is good for math in that every programming language is good for math, but more to the point it has a REPL (read-eval-print-loop, aka command prompt) so you can work with it interactively - assign variables, define functions, etc. A lot of the modern machine learning stuff runs on python too. Advanced line-editing functionality probably makes the editing experience better than a calculator in terms of input, but I haven't touched a physical calculator in a while and barely use calculator apps so can't say for sure. Back when I did more serious math, I used a fair amount of Sage, which was also built on top of python.
IPython and/or Jupyter notebooks are also something to look at.
If you ever need a computer to solve it for you, there's an entire programming language/environment dedicated to this kind of math called Macaulay 2, although I think Sage math handles it too and it's based on Python rather than its own syntax
I went down the SageMath rabbit hole a couple months ago, it's a lot of fun because it's basically for all levels and areas of math. Run it as a JupyterLab and you basically have all the power of python with the convenience of doing math in a notebook.
Se você tem e-mail institucional você talvez tneha acesso ao programa do Wolfram.
Também tem a linguagem Sage de matemática simbólica que basicamente uma versão aberta do Wolfram, e é brasileiro inclusive.
May I introduce sagemath it's free (in which you don't have to pay money which is good) it's got all the algebra tools, and will try very hard to preserve actual value, and it can interface with the python Jupyter notebook
also libqalculate comes with a banger cli calculator that preserves actual value too
I'm pretty happy with the TI-36X Pro. It is really useful when working with complex numbers, and it has a lot of nice capabilities overall. Also, because it's not a graphing calculator, I'm able to use it for exams in a lot of my classes. When I'm working on homework or something else where I have access to my computer though, I like to use SageMath since I can just store all given data for a problem in variables and solve the problem algebraically. (Also it does a lot of the heavy lifting when I need to work with vectors.)
The world you are looking for is "symbolic math". A good functional language with excellent symbolic math is Mathematica. Maple is more like Python but also does this quite well. SageMath literally based on Python is pretty good.
Mostly since those packages are better, a symbolic math engine is a lot different than a general purpose math engine and performance matters a good symbolic math in Haskell hasn't evolved.
If you already know Python, then SageMath would probably be the easiest option to go with. I've used it before, and even though I don't have much experience with Python it was pretty quick to pickup (and that Python is notoriously simple to get used to probably helps). Mathematica is powerful, but expensive, and it requires a very different mindset for programming than most people are used to. It's also quite expensive, while SageMath is free.
I don't have any experience with MATLAB so I can't give you much advice there.
I'm sorry, I still don't think I know what your question is.
What finite area are you talking about?
Are you asking how we draw it out on a piece of paper?
In that case we just truncate it at a certain point.
If not, could you clarify or maybe circle the area you're talking about on a graph?
Maybe use this graph
You could look into Sage. Sage (or sage-math) is a computer algebra system using Python as its language. Computer algebra systems do symbolic manipulation of formulas. They can do things like factoring (multivariate) polynomials, Taylor series expansions, calculating with finite fields and so on. They are very useful for "experimental mathematics", which imho is an unfairly neglected approach of doing mathematics. You can for example create algorithms to calculate topological invariants, and conjecture things based on the results.
All this said, I personally dislike Python, and especially given your interest in type theory, there is a chance that you will dislike it too. It's a language designed to be easy to get into, but it's not a "good" language.
Unfortunately, computer algebra systems tend to be "dynamically typed", probably because it's just too hard to make them both work and be convenient to use within a proper type theoretical framework.
Wir hatten den TI Nspire CX aber mittlerweile bin ich total von SageMath überzeugt. Ist einfach viel angenehmer zu tippen als mit einer Tastatur die alphabetisch ist.
You really ought to take a look at SageMath. It's free and open source using Python as its scripting language. It's incredibly comprehensive, as you will see by glancing over its documentation, on the help page, and on the reference manual page.
Sagemath is an opensource alternative to Mathematica https://www.sagemath.org/
It can plot complex variable functions https://doc.sagemath.org/html/en/reference/plotting/sage/plot/complex_plot.html
Can be either installed locally or used online though https://cocalc.com/
PS: The book Visual Complex Analysis by Needham is very good for gaining intuition and he explains alternative ways two visualize complex functions,
I moved my research analysis and graphical presentation from Excel/Origin/Mathematica to python with matplotlib as the graph generator.
If you are coming from something like Origin or Sigmaplot (presumably graphad prism, but I never used it) there is a jump since matplotlib as it is has no UI. That in itself might be a little off-putting. When explaining matplotlib/pandas to complete coding newbies I found that explaining that everything goes top to bottom and showing them how to execute examples was a good start, where they could reverse-engineer what they needed further.
Simply grabbing data and plotting it, is not as hard as it seems. If you import your data using pandas, and the structure of it is not overly complex, you can plot it beautifully in a couple of lines. Tuning the graphs requires some reading, but most of it would be following pre-made examples.
My main motivator to go to python for data analysis and visualisation was that it, allegedly, made repetitive things faster and more stable than Excel macros. I cannot overstate how much time I gained by maintaining several pre-made jupyter notebooks. Sure, it cost me some time to learn basic python. But after recognizing possibilities for automation and implementing them over months of data analysis, was more than worth the time invested to learn how to code them.
Additionally coding, especially in python is a skill useful for the future. Whether for hobby or for a job, python is very, very handy.
A useful place to start might be sagemath - https://www.sagemath.org/index.html
tl;dr If you have a lot of data to analyze with room for automation it is worth to invest the time into python/R
Cryptographers, once committed to a subject, will do whatever is needed to learn the math behind that subject. We saw it in the 00's when pairing-based cryptography took off and suddenly lots of cryptographers started learning the bare minimum math knowledge needed to understand pairings (which turns out to be a fair bit of computational arithmetic geometry). But pairing-based cryptography reached a level of mainstream acceptance that isogenies have not (yet) reached, so it is a bit of a risk to take the isogeny path right now when you don't have that math PhD. Some people have done it, even people who are unambiguously CS/applied crypto (for example, Dan Boneh in this paper). I think if you are not already familiar with the math then you should hedge your bets by spending only part of your time on isogenies until you feel that you are comfortable enough with them to start working on them more intensely. Nobody starts out knowing everything. It's a process for all of us.
A good place to start is not with reading or classes, but with implementation. SAGE has all the mathematical functions you need for isogeny cryptography, built in to the program, so it's not very hard to get started. Implementing the schemes gives you a feel for what they really look like and how they behave. You learn the features and limitations of the systems in a way that pure reading does not allow.
I've never worked with Frenet-Serret system, but you might have a look at sagemath here
Its a free mathematics software based on python with all sorts of goodies built in and may be able to help
Good for you for caring about free software. Sage is great! But I don't think many sage gurus pay attention to reddit so often. On the other hand, the sage support mailing list is very active and many people extremely well versed in sage pay a lot of attention to it. So if you don't find an answer here, I suggest you try there.
I'll note that sage and sympy has some support for multivariable integrals. I don't personally know much about them though.
I would recommend starting with computational algebraic geometry, using a book like Ideals, Varieties, and Algorithms by Cox, Little, and O'Shea (prerequisites: linear algebra and a proofs course such as introductory abstract algebra). Algebraic geometry can really be very concrete, with lots and lots of examples and computations. In my opinion that's the best way to get started. For computations there is software like SageMath that you can use (to try things out or check your work), and you can even implement some of the classical algorithms such as multivariate polynomial division and Buchberger's algorithm by yourself.
You might also like Algebraic Geometry: A Problem Solving Approach by Garrity et al.
Hyperbolas and parabolas are fundamentally different. Parabolas are second-order one-to-one functions. It is second order because your x term is squared (power of 2). It is one-to-one because each value for x corresponds to only one y-value: you plug in a number into y = ax^(2) + bx + c and get out only one y value.
Hyperbolas are are defined around asymptotes, lines that the curves approach but do not cross. Hyperbolas are not one-to-one: for many x-values on the linked graph, there can be multiple y-values (usually two).
You are very unlikely to see hyperbolas appear on the MCAT. They have little relevance to the science concepts on the MCAT, at least for the level of understanding required.
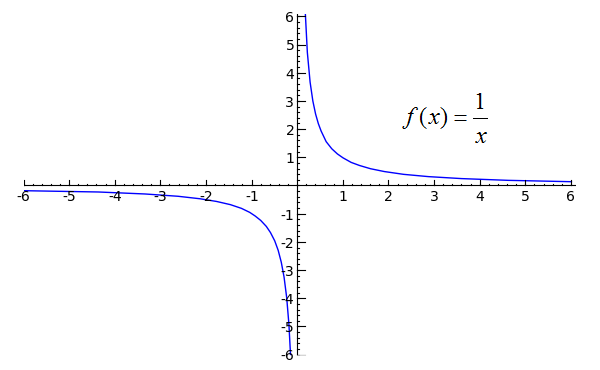
Another visually similar function is the inverse function. The most basic form of this is y = 1 / x. It also involves asymptotes: for y = 1 / x, y and x can never be 0 because you cannot divide by 0 and you cannot get 0 from dividing 1 by a number.
Both parabolic and inverse functions are useful to recognize on the MCAT.
To clarify, I was a pure maths major.
In my experience I used programming in numerical methods (finding roots, interpolating, differential equations, etc) using MATLAB. I used Python for an awesome intro to (algebraic) number theory course. It was taught by a professor that does computational number theory. So we got to implement very basic but nice algorithms, (division algorithms in some rings, gcd, primality tests, etc) all leading up to implement RSA encryption (done from scratch).
Sage is a Python based specialized math software. Which I actually used to implement some more advanced stuff for my thesis. I do not know the full extent of the language but I believe it lets you work on some fairly advanced (abstract) structures.
Also took an econometrics course where we used STATA (awful language in my opinion). This was just linear models and such.
I think programming is a complement to mathematics (a very useful one). For most subjects, I think you could find a computational approach which is awesome to me.
However useful and interesting programming may be, it is not necessary for learning most math subjects. But it is necessary if you are interested in applying mathematics to the ‘real world’.
> The math library for Bob Morris's variable-precision desk calculator used backward error analysis to determine the precision necessary at each step to attain the user-specified precision of the result. In my software-components talk at the 1968 NATO conference on software engineering, I posited measurement-standard routines, which could deliver results of any desired precision, but did not know how to design one. dc still has the only such routines I know of.
I thought this was common among modern computer algebra systems? I suppose I'm unsure how they work internally but tools such as SageMath can compute an expression to a user-requested accuracy.
Still impressive, though!
I used SageMath to find a curve and run computation. It is a free software and can be used online here.
For example, the code used here is
p = 10000687 E = EllipticCurve(GF(p), [0,7]) r = E.cardinality() P = E.random_element() Q = E.random_element() n = P.discrete_log(Q)
The discrete_log method implements an algorithm that has a running time on the order of the square root of p, therefore it is pretty fast on such a small elliptic curve.
Your best bets for AI are Python and R. The former is a better language and is typically used for putting machine learning models into production but the latter, while very janky, can be applied to almost any statistical task you have in mind. Python is not there yet. Nevertheless, since you say you are trying to go down "the math path", you should be advised that there is an "everything including the kitchen sink" computer algebra system based on Python, SageMath. Regarding Julia, I've looked into it and it looks promising but it's not all there yet; documentation isn't what it needs to be, so forth. I wouldn't chance it as a beginner.
What you are describing – including the name "computational notebook" – is the concept that was introduced by Stephen Wolfram with Mathematica in 1988. Over the last 30 years, notebooks have evolved into versions more suited for data science such as (python-based) Jupyter, versions more oriented towards math like the one you describe (take a look at https://www.sagemath.org/ for instance), while Wolfram Mathematica is designed for both. As always, Wikipedia is a good place to start https://en.wikipedia.org/wiki/Notebook_interface .