
What are
/r/MathHelp's
favorite Products & Services?
From 3.5 billion Reddit comments
The most popular Products mentioned in /r/MathHelp:


The most popular Services mentioned in /r/MathHelp:
Desmos
GeoGebra
Brilliant.org
Khan Academy
Wikimedia Commons
Overleaf
Mathway
Omni Calculator
vgy.me
Project Gutenberg
DocDroid
Google Play Books
Repl.it
DeepL Translator
Cymath
The most popular Android Apps mentioned in /r/MathHelp:

The most popular reviews in /r/MathHelp:
I am not familiar with the canadian cirriculum, but assuming you've learned trig functions, identities, exponentials, and logarithms i'd think you should be ok.
​
You can check out "Calculus Made Easy" for online - it's part of Project Gutenberg (free online e-books):
I know this is probably not the answer you're hoping for, but there is seriously a lot of math packed into an Algebra 2 course. It's not so simple to just type out all the "rules of mathematics." The best place I can think of to start is the Khan Academy. It's a seriously incredible resource for learning math. Very clear, direct, and not overly complicated.
Sure, a series is just a sequence that is being added together.
So, while a sequence is just a list of numbers: 1,3,5,7...
a series would be 1+3+5+7+...
We show something is a series by using the greek letter sigma, ∑.
Underneath the ∑ we write "n=1" to say which term we start adding from. Above the ∑ we write which term to go until. To the right of the ∑ we write the explicit formula for the series. For example:
5
∑ 3(2)^n-1
n=1
means to add from the first term (n=1) to the 5th term, and each term is found by using the explicit formula 3(2)^n-1 . You should recognize this explicit formula as the geometric sequence with first term 3 and common ratio 2. Since this is a series, we call it a geometric series.
To make it a little easier to type, instead of putting the bounds above and below sigma, I'll just write ∑(from n=1 to 5)
∑ (from n=1 to 5) 3(2)^n-1 = 3(2)^1-1 + 3(2)^2-1 + 3(2)^3-1 + 3(2)^4-1 + 3(2)^5-1
= 3(2)^0 + 3(2)^1 + 3(2)^2 + 3(2)^3 + 3(2)^4
= 3(1) + 3(2) + 3(4) + 3(8) + 3(16)
= 3 + 6 + 12 + 24 + 48
= 93
The general formula for a geometric series is:
∑ (from n=1 to _ ) a1*(r)^n-1
The general formula for an arithmetic series is:
∑ (from n=1 to _) a1 + (n-1)*d
A more common way to write a series is using "i" to represent which term, and "n" to represent the highest term. That looks like:
Geometric series:
∑ (from i=1 to n) a1*(r)^i-1
Arithmetic series:
∑ (from i=1 to n) a1 + (i-1)d
Now it would be pretty annoying to have to write out every term and actually add them up, especially if we were doing a lot of terms, like from n=1 to 60. Luckily there is a formula that tells you what the sum of a geometric or arithmetic series will be.
I don't have those off the top off my head right now but you can learn all about this stuff here: http://www.khanacademy.org/math/calculus/sequences_series_approx_calc/seq_series_review/v/sequences-and-series--part-1
Bingo. Therefore, at the exact point where x is 5, the slope of the function f(x)=x^2 is 10.
If you really want to learn about this stuff, I've found the Khan Academy to be one of the best resources out there. Here is a link to the first of their videos on derivatives.
KQ = Pq / B(W)^(1/2) * f(a/W)
f(a/W) means that the variables inputted are (a/W) instead of x.
> f(a/W) = (2 + a/W)(0.886 + 4.64(a/W) - 13.32(a/W)^2 + 14.72(a/W)^3 -5.6(a/W)^4 ) / (1 - (a/W)^(3/2) )
This can be simplified as: (and when I say "simplified" I actually mean "more readable")
> f(x) = (2 + x)(0.886 + 4.64x - 13.32x^2 + 14.72x^3 -5.6x^4 ) / (1 -x^(3/2) )
> x = a/W
In other words, treat a/W as a single variable instead of 2 variables.
Also, I found your problem almost word-by-word here so it seems as though you're missing context from a previous question in order to solve this.
perhaps it'll help if you sketch the graph. https://www.desmos.com/calculator
finding the coordinate of the vertex is a good starting point, but it is not the answer you are looking for (as you've already discovered)
The normal at (2.707, -0.5) passes through (2.707, –0.5) and (2, 0). You're right that it continues on and would cross the parabola again at (0.586, 1), but that's not where it's perpendicular to the parabola. It's perpendicular to the tangent at (2.707, -0.5).
>(1.293, -0.5) doesn't touch the parabola?
It most certainly is a point on the parabola. It's the mirror image of the other point across the axis of the parabola. It's ((4 – sqrt(2))/2, –1/2).
https://www.desmos.com/calculator/v2hshhex9e
At (1.293, –0.5), the tangent line has slope –sqrt(2). At that point the normal has slope 1/sqrt(2) and the normal passes through (2, 0).
To assess the limit, it's important to first divide the numerator by the denominator h.
lim (3x^(2)h + 3xh^2 + h^3 – 2h) / h
lim (3x^2 + 3xh + h^2 – 2)
Two of the terms disappear when you take the limit as h approaches 0.
What is the final expression after you take the limit?
In part b) it looks like what you did was find the three places where the curve crosses the x-axis. This does not answer the question.
In fact, you can see that the slopes at the points you found are +4, –2, and +4. See this desmos graph.
https://www.desmos.com/calculator/pxldetze0e
The question is what are the places where the graph of the equation has tangent lines that would be horizontal?
Using the derivative you find in part (a) and setting it equal to 0 will help you answer that question. It will take a little algebraic manipulation to solve.
Numbers are relatively nice. Two answers, both integers.
Set f(x) = g(x) to find when they intersect.
mx^2 - (m + 2)x + m + 2 = x - 1
mx^2 –mx –2x + m + 2 – x + 1 = 0
mx^2 – (mx + 2x + 1x) + m + 3 = 0
mx^2 – (m + 3)x + (m + 3) = 0
Using a = m, b = –(m+3), and c = (m+3), we want to find when there is just one solution, which is when discriminant b^2 - 4ac is zero.
b^2 – 4ac = 0
[–(m+3)]^2 – 4(m)(m+3) = 0
We can replace –(m+3) with (m+3) because squares of both are same.
(m+3)^2 – 4m(m+3) = 0
This happens to factor, so we won't need the quadratic formula.
(m+3)(m+3) – 4m(m+3) = 0
(m + 3 – 4m)(m + 3) = 0
(3 – 3m)(m + 3) = 0
This means you can use zero product property and find the two integer solutions for m.
Here's a desmos animation.
I think your overly confused and overthinking :).
the rate of change is indeed which means slope=m=20. The point is (2,20) as well.
equation of a tangent link y=20x-20 if you use point and a slope.
Highly recommend you use (https://www.desmos.com) and play with this yourself.
In application you mostly dont use derivative to find the tangent line, thats not mainly what it is about (though thats just math textbooks).
Derivatives just mean tiny change, in physics a tiny change in velocity over a small fraction of time is what we call a slope a well. v/t=x
There are tremendous amounts of useful applications which you probably have not covered yet.
all derivative means is dy=(tiny change of y) divide by (tinychangeofx)=dx. dy/dx=slope.
The new one. The old equation merely tells you where the function isn't defined.
Think about it; for all values of x other than x = 2, (x^2 - 5x + 6)/(x-2) = (x-3), no? So their graphs should be exactly the same at all of these points.
Now what happens when x = 2? The original function isn't defined (since you can't divide by zero).
Plot it yourself if you don't believe me.
> A slant asymptote is when the numerator is one degree larger than the denominator
Well, technically you could say that the denominator of that equation is 1.
> so y = (x-3) by itself would not have a slant asymptote.
Correct, purely because of the technicality in the definition of asymptote that the graph can't actually touch the asymptote (after some time).
Now, does y=(x^2 - 5x + 6)/(x-1) have any asymptotes, and if so, what are they?
u dot v = 0
right?
so...
<1,a> dot <2,b> = 0
solving for a for b and keeping u in terms of coefficient a should yield orthogonal vectors.
https://www.geogebra.org/graphing/kuztnw9h
please play with slider "a" and observe orthogonality between the two vectors.
The same has to be done for coefficient b to observe orthogonality between u and v in terms of b.
Graph the two variables (the two Power Levels you're changing) against the total power level. You should be able to find a 3D plotter online.
The point of doing this is to determine what sort of relationship you have between the two variables and the total power level. If, for instance, there is a linear relationship, then you end up graphing a plane.
(It's a real shame that we don't have 5D plotters, or this might be a fair bit easier. Oh well.)
Honestly there isn't a whole lot of trig you have to know for calc.
Unit circle(focus with radians) or Pi/3-Pi/6-Pi/2 and Pi/4-Pi/4-Pi/2 triangles.
Pythagorean identities and other identities for sin^(2)(x) and cos^(2)(x)
Double angle identities wouldn't hurt but aren't a huge deal either - can always look them up when needed.
Their graphs (mainly behaviors, max, min, and any asymptotes if they exist)
http://www.khanacademy.org/ is a good site...I don't know if they have practice problems but they'll have decent explanations.
thanks. I tried graphing it and it looked like this.
We're not supposed to use one sided limits or differentiation or anything like that, but then the lecturer also said that if the limit exists it'd have to be both sided so i was confused a bit.
Nothing. That is indeed an estimate of the slope. It's a very inaccurate estimate, unfortunately, but this is due to how quickly sin(10pi/x) oscillates near 0.
Here is a graph of y = sin(10pi/x), the line joining the two points (.96,.965926) and (1.04,-0.935016), and the tangent to y = sin(10pi/x) at x = 1. If you zoom out, you can see that sin(10pi/x) oscillates near 0, and it still oscillates pretty badly near 1.
Yes, the particular function I'm looking for can be graphed via its Taylor series
​
It looks like something along the lines of e^(x) + sin(sqrt(abs(x)). Is there a simpler function I'm missing that can produce the above graph?
... it’s the next day now. Paste:
I ended up completing my graph by replacing my failed formula with a very different one I found online. It is animated and the points can be dragged anywhere! Here it is: https://www.desmos.com/calculator/ayef9u04dg
Woah, that’s pretty cool!
I ended up completing my graph by replacing my failed formula with a very different one I found online. It is animated and the points can be dragged! Here it is: https://www.desmos.com/calculator/ayef9u04dg
I set up a desmos graph, and a couple of imgur links to demonstrate how you'd translate this into math. Its available here. If you're confused about anything with it, sorry! I'm happy to answer any questions on it as needed!
I actually have a Desmos graph for explaining exactly this stuff
θ is the angle between the black dotted line and the horizontal x-axis, and the lengths of the color-coded lines are the values of their corresponding functions.
The trig functions are based on the unit circle, which is a circle with a radius of 1. The radius of the circle for your pendulum is the length of your pendulum, so you just multiply it by that length.
From that picture, you can see that cosine is the x-coordinate of the point and sine is the y-coordinate. The zero-angle is on the right side of the circle.
So, if your pendulum has length L and you put your zero at the top of the swing, L*cos(θ) is the height of the pendulum relative to its pivot. If you made your zero horizontal that height would be L*sin(θ), and if you put it at the bottom the height would be -L*cos(θ).
> is it DNE because the sinx oscillates at ∞ or 0
Just because a function "oscillates", it doesn't mean that the limit doesn't exist. For instance, f(x) = x sin(1/x) + 5 has a limit at x = 0 despite oscillating there, and you can see this by graphing it; f(x) tends to 5 as x tends to 0, because the function is "heading towards" 5.
(Another thing I'd like to point out is your use of "DNE". "DNE" is an abbreviation for "does not exist". Saying "is it DNE" or "the limit is DNE" is saying "is it does not exist", or "the limit is does not exist", which is grammatically unsound. Say "does it not exist" or "the limit does not exist" or "the limit DNE" instead.)
> because lim(x/(x^2+1)) is zero and even if sinx oscillates it's between defined interval (1, -1)?
It's not at all clear how this supports your conclusion that the limit does not exist.
Anything to the zeroth power is one. It allows for the rules of adding exponents to work. Our rules of exponentiation say that k^a * k^b = k^a+b. The converse is also true, so that means that we can write k^a+0 in two ways: k^a and k^a * k^0. Since these are both equal to k^a+0 , we have to say that the k^0 is equal to one.
A fun thing to explore is the value of 0^0. Zero to the anything is zero, but anything to the zero is one. This seems kind of tricky. 0^0 looks like it should be one based on this graph.
Thanks for the help! I managed to make the following equation, where y = x: ((x-1)(x+2.5)^2)/(x+2)^2 https://www.desmos.com/calculator/njlwc4ffny When x = 58, y = 57.953958. But I think that y would eventually have the exact same value as x later on.
a) well think of a sin wave : https://www.desmos.com/calculator/csbokjings
at 0, f(0) = 0
pi/2, f(pi/2) = 1
pi, f(pi) = 0
3pi/2, f(3pi/2) = -1
2pi, f(2pi) = 0
5pi/2, f(5pi/2) = 1
can you see the pattern? Every 2 pi, the sine function repeats itself
you would write it as x = pi/2 + 2kpi, where K is a set of integers
​
for b) I was asking you if you knew the derivative of cosx, unless I read the question wrong and you meant that the original function is sin x and you found the derivative to be cos x
Using the same idea can you find when cos x = 0?
​
I still think a more realistic answer is that when the bike leaves the ramp, it must be traveling with slope 6/5.
The trajectory of the bike that goes into the air at (5, 6) traveling with slope 6/5 at that instant,and that lands at (20, 0) is show in green in this graph:
https://www.desmos.com/calculator/jaeehchcf2
Its vertex is higher than (10, 8), so it also "misses the fire."
Notice if you extend this parabola backward from (5, 6) it does not pass through (0, 0). That explains why x-coordinate of its vertex is not 10 but a little more than 10.
You might point out to teacher that this green curve is the real path of the bike, not the red curve of the parabola that includes (0, 0).
A challenge for you is to figure out the equation of that green curve.
If i told you that the SLOPE of a tangent line that just touches the parabola with equation
y = ax^2 + bx + c
can be found by using this expression
slope = 2ax + b
Can you express your parabola equation in the y = ax^2 + bx + c form and then say what the slope of the tangent is when x = 5?
That is, if the parabola represents the path of the bike, what is the slope just as the bike leaves the ramp at (5, 6)?
See this diagram. I am talking about the slope of the red dotted line:
https://www.desmos.com/calculator/m1efiredxv
The slope of the ramp is shown in green. It is 6/5.
81 or 82, the thing I needed to know is for the sake of argumentation: "Even if you have a 3% chance of success, after 82 tries your chance of succeeding at least once is now roughly 90%."
So I can play around with this, what formula did you use for your geogebra? https://www.geogebra.org/calculator
This isn’t a conventional LA text. It’s an introduction to Linear Algebra and Geometric Algebra, which is fascinating. Highly recommended.
You would use it as normally! Let's gather what we have so far.
We started off with 6=12sin(6t) and we divided by 12 so:
0.5=sin(6t)
Now we take the inverse sine function, don't forget you must do it on both sides!
arcsin(0.5)=arcsin(sin(6t))
arcsin(0.5)=pi/6 (Look it up in a table, or your calculator if you want to convince yourself)
arcsin(sin(6t))=6t (This is the definition of an inverse function)
So we have:
pi/6=6t
Continue now by solving for t, which I belive you know how to do so I'll just do it:
t=pi/36
Now however, this is a bit wrong what we did here as we skipped to take into account the periodicity of the trigonometric functions. Because if you use your calculator and plug in pi/36 as t, you will see that it does satisfy the equation. But I would like you to try and use your calculator to plug in t=5pi/36 and see if it does satisfy the equation, then try t=13pi/36. It turns out that there are infintely many solutions. In order to convince you of this, I graphed the function for you:https://www.desmos.com/calculator/xqsokutlxn
Everytime the blue and red line intersects, that is a valid value for t that satisfies the equation. Of course you, the question asked for the smallest positive value, so that is the one we first calculated t=pi/36.
Of course it would be very tedius for us if we need to graph all the time, luckily we don't need to. However I do not think I have the stamina right now to fully explain how to do it algebraicly. I'm sure you can find some great resources online, or ask your teacher. Good luck!
Sorry, I figured this out on my own! It doesn't ask for the domain not sure why I was tryna find it, but anyways here is the graph! Kinda had a brain fart all around
Okay, I interpret that as x-axis is horizontal and y-axis is vertical, and x = sqrt(4 – y^(2)) is a half-circle on the right side of the diagram, with radius 2.
Stretching this vertically with scale factor 3 (in the direction of the y-axis) requires you to replace "y" with "y/3" in the equation.
Translating this 2 units to the left requires you to replace "x" with "x – (–2)" in the equation.
That's all you need to do. Can you see how that will eventually allow you to achieve the answer you saw?
https://www.desmos.com/calculator/kbqh7ytn14
Do you need an explanation for why replacing y with y/3 stretches by a scale factor of 3 in the y direction instead of squishing things?
Do you need an explanation for why replacing x with x – (–2) works instead of replacing it with x + (–2)?
To help you visualize it, I plotted the relationship in Desmos to show you how much more valuable DEX is than I. The red graph shows increases in damage when DEX increases and I=1. The blue graph shows the increase in damage when INT increases and DEX=1. Notice how much more damage increases when DEX increases, shown by the steeper slope of the red graph than the blue, and the greater value DEX has after DEX and INT are both more than 1, which they will (hopefully) always be.
For the entire thing to be 0 you need either:
tan(x) = 0
sin^2 (x) -a = 0 or
sec(x) -a = 0
Now depending on the value of a, this may give different roots.
Here are some hints:
Since tan(x) does not depend on a, its roots will be the same in either case.
sin^2 (x) can never go over 1 no matter what x is. So sin^2 (x) -a may not always have roots
Likewise sec(x) can never go below 1 no matter what x is so sec(x) - a may not always have roots.
sin^2 (x) -a = 0 can be rewritten as sin^2 (x) = a and ultimately simplified to sin(x) = sqrt(a)
Here are some graphs if you need to visualize it: https://www.desmos.com/calculator/yfmloacdj2
Perhaps this graphical solution will help. I've plotted out the solutions to the equations |z| = 1 and |z+sqrt(5)i| = 1 (expanded out into real and imaginary parts. As you can see, they intersect nowhere, so there's no solution.
With the solution given, the first bit basically expands out the equations in terms of a and b. Then it shows that this implies that b = -sqrt(5)/2 if you try and solve it. But, because |b| < 1 (otherwise you can't possibly satisfy a^(2) + b^(2) = 1), we have a contradiction.
> By the same logic, you shouldn’t be able to take the square root of a negative number.
Do go on and show us this argument then. Because as far as I'm aware, defining "i" doesn't cause any contradictions with the "=" sign, whereas defining your number does.
> I know that i*i = -1 in the same way that I know that (a²+s)=√[(a+1)(a-1)].
I'm assuming you meant (a+s), not (a^(2)+s).
So let's take your example where (a+s) = sqrt((a+1)(a-1)) for all a (and s = 1 and s = -1 but somehow 1 != -1).
Then for a = 2, we have that 2+s = sqrt((2+1)(2-1)) = sqrt(3). So we have that s = sqrt(3)-2, which is neither 1 nor -1.
And for a = 0, we can say that s = sqrt(-1) = i.
And for a = -2, we can say that s = sqrt((-2+1)(-2-1)) + 2 = sqrt(3)+2.
For any value greater than 1 that you pick, in fact, I can pick a value of a such that s is equal to that value. I can also do the same for any value between -1 and 0. Are you still so sure that "s" can be defined as both 1 and -1 at the same time (and nothing else)?
> neither can be represented properly unless a function acts upon them putting them into the real number line
But "i" is represented properly, as "i", because we know it doesn't cause contradictions. The same isn't true for "s".
What function did you have in mind for "s"?
> all other representations are simply relations between the real number line and the imaginary number line.
Please clarify what you mean by this.
> I graphed the sequence and looking at it, it seems that it does decrease for every n (except n = 0, in which it is undefined) and its limit is -ln(8).
Does it? Are you sure it's not actually increasing so slowly that it looks really flat?
Here is a graph of the function from 0 to 10. (See here for an image version.) Note that it's actually increasing for x>4 (roughly). It's increasing so slowly that I had to rescale the y-axis by quite a bit.
Note that if you have two monotonic functions f and g, then it's the case that f(g(x)) is also monotonic. So if you rewrote ln(n^3 + 5) - ln(8n^3 + 15n) as a single logarithm, you could then take that as g, and take e^(x) (a monotonic function) as f, which would give you a non-monotonic function for f(g(x)). This shows that g is indeed non-monotonic.
I'd say it depends on the precision with which you want to express the result:
If you perform 100 tasks on the device you will have an accuracy of 1%.
So if you complete 90/100 you will have a percentage of 90% of tasks completed, if you complete 99/100 you will have a percentage of 99% and so on...
To have a percentage with decimals you have to increase the number of tasks. The request is for one decimal place only, so you just need to run 1000 tasks and see how many complete.
If you complete 998/1000 of them, it means that you will have a percentage of 99.8% of tasks completed.
If, for example, you needed a percentage of 99.82%, so to 2 decimals, you had to run 10000 of them.
​
Translated with www.DeepL.com/Translator
Proof here: https://www.overleaf.com/read/bnjpzxhkgpvh
Essentially its the law of cosines and the Pythagorean theorem that is the geometry lurking behind the math.
Here's the link to the calc I used
So you have the right probability for picking a brightly colored guppy in a single trial: 65%.
The first question is to find the odds of picking exactly 7 brightly colored when you randomly pick 10, one at a time, with replacement.
The odds of getting exactly 7/10 bright ones means you also picked exactly 3/10 drab ones. The odds of picking a drab one in a single trial are 35%.
To combine these odds, you multiply them together. The odds of getting 7 bright ones are 65%^7 = 0.65^7 = 0.049 = 4.9%. The odds of getting 3 drab ones are 35%^3 = 0.35^3 = .043 = 4.3%. The odds of getting 7 bright AND 3 drab are 4.9% x 4.3% = 0.0021 = 0.21%.
But be careful. This number represents the odds of getting 7 bright and 3 drab in one particular order. We now have to account for the fact that there are many orders in which you could make this selection. For example, B B B B B B B D D D is one order, and B B D B B D B B D B is another order.
How many different orders are there? To calculate this, there is a formula called 'choose'. The answer to the question "how many ways can I choose 7 from a set of 10?" is defined as the function '10 choose 7'. The answer is 120 (you can follow that link to find explanations of the formula -- it uses factorials).
Finally, we take the number of orders, 120, and multiply it by the odds of selecting (7 bright & 3 drab) in one particular order, 0.21%. The result is 120 * 0.21% = 0.252 = 25.2%.
Do you think you can take it from here?
It was part of a much larger expression that I have factored but I don't understand how to factor the negatives or why that works?
https://www.desmos.com/calculator/kp89aanz6m
Play around with this tool - I feel like it will give you a better picture than a verbal explanation.
Keep in mind that the roots of a parabola are simply the x values for which the expression is worth zero - so if you can get it to the form (x-5)*(x-6) , then if x is 5 or 6 you get zero, which then multiplies everything else so that the entire expression is zero.
And since the graph line represents the value of the expression for all x's, the points where it crosses the x axis are the x's where the expression is 0.
Handwritten work? That's probably too much to ask for here!
Suppose x is a certain (fixed) value. It seems you want to understand why one and only one value y satisfies the equation x^2 + y^3 = 1 (in other words, why y is uniquely determined by x.)
Since x^2 is a function of x -- ie. x^2 is uniquely determined by x -- it's enough to consider an equation (for example, with x = 3)
9 + y^3 = 1.
For any two distinct values of y, the values y^3 are distinct, so the values 9 + y^3 are also distinct -- thus the equation cannot be satisfied by two distinct values of y.
Another way to understand is to to graph x^2 + y^3 = 1.
This isn't the right area. Try /r/TRADE or a similar sub.
Or eBay or Amazon or something.
(Also, you won't actually need a graphing calculator if you're good enough at mathematics. The only things you'll ever need to graph in an exam are things you should already know how to graph; things outside an exam can be graphed with an online graphing calculator like Desmos.)
Sorry about the lack of information as I quickly wrote it.
I've plotted a sinusoid of 3sin4(ϴ) in radians and the question is What is the value of ϴ at 50 degrees?
I've converted 50 degrees into radians giving me an answer of 0.872664626, but now I'm stuck at how to use this number. I cheated by going onto desmos and using the graphical calculator.
3sin4(50) = -2.61989189164
The question is really how did they get this as I think I have to use it by eyeballing it from the graph.
Edit - Finally found out. Nevermind.
I used desmos.com to generate a regression, so that's one method. I used a cubic formula of ax^3 + bx^2 + cx + d to find the best-fit equation, which could be said to be: 0.16667x^3 - 2x^2 + 4.8333x + 7
I have no idea how to do it algebraically though. I'm not that educated yet.
Instead, Try this equation of a Circle: r^2 = (x - h)^2 + (y - k)^2 Where r is the radius, and (h,k) is the center of the circle.
Use your three points to set up three equations, I'll call them A, B, and C
A: r^2 = (7 - h)^2 + (-1 - k)^2
B: r^2 = (11 - h)^2 + (-5 - k)^2
C: r^2 = (3 - h)^2 + (-5 - k)^2
........
Notice that all three of these equal r^2 so we can use the power of transitivity (If X=Y and Y=Z then X=Z) to say:
(7 - h)^2 + (-1 - k)^2 = (11 - h)^2 + (-5 - k)^2 Multiply things out...
49 - 14h + h^2 + 1 + 2k + k^2 = 121 - 22h + h^2 + 25 + 10k + k^2 Now when we combine the like terms the h^2 and k^2 will get rid of each other:
49-121 -14h + 22h + h^2 - h^2 + 1 - 25 + 2k - 10k + k^2 -k^2 = 0
-72 + 8h -24 -8k = 0
-96 + 8h -8k = 0 Call this equation D
........
Now do the same thing all over again with A and C
(7 - h)^2 + (-1 - k)^2 = (3 - h)^2 + (-5 - k)^2
49 - 14h + h^2 + 1 + 2k + k^2 = 9 - 6h + h^2 + 25 +10k + k^2
49 -9 - 14h + 6h + h^2 - h^2 + 1 - 25 + 2k - 10k + k^2 - k^2 = 0
40 - 8h -24 -8k = 0
16 - 8h -8k = 0 Call this Equation E
........
Now combine Equations D and E using transitivity (they both equal 0)
-96 + 8h -8k = 16 - 8h -8k
8h + 8h - 8k + 8k = 16 + 96
16h = 112
h = 7
........
Now that we have that plug it into either D or E to find k:
16 - 8(7) - 8k = 0
16 - 56 -8k = 0
-40 -8k =
-8k = 40
k = -5
........
Lastly, plug those both into A, B, or C to find r:
r^2 = (7 - 7)^2 + (-1 + 5)^2
r^2 = 0 + (4)^2
r = 4
........
You have all the pieces so now...
Click the equation to see it's graph. If you want the equation to be in the form that you wrote in the description just start distributing and solving.
Edit: Spacing for visual ease.
Look into the Chinese Remainder Theorem. Since 3 is a factor of 6, you'll have to make a modification for non-coprime moduli.
Direct substitution "rarely" works because the problems are designed to make you perform operations in order to find an answer, not plug-and-chug. I say "rarely" for the following reason. Suppose you have a function which is discontinuous at x=0, but the question asks for the limit at x=1. Then this will clearly work because the function is continuous at x=1 and presumably you'll have a value to go along with it. These are not typical questions you'll find.
One problem with your original statement: the numerator CAN be equal to zero. There is nothing wrong with that unless it is paired with something else which results in an indeterminate form. For example, lim x->1 of (1-x)/x. Numerator = 0, denominator = 1. Result, lim = 0.
As for checking for discontinuities without graphing, see discontinuities.
There is an explanation of how to integrate ln(x) here.
To save you a click, here is the explanation:
If you define the function f(x) = ln(x) and g'(x) = 1, you can treat ln(x) as a product of the two functions f(x)g'(x). Following the rules of integration by parts, the indefinite integral of f(x)*g'(x) is equal to f(x)g(x) minus the indefinite intetgral of f'(x)g(x).
Since the anti-derivative of g'(x)=1 is g(x)=x+c, you can plug all of this into the equation and get x ln (X) - x/x + c as your final antiderivative.
For your specific case it's a bit more complicated, since you have a composite function, so you'll have to reverse the chain rule, but I trust you can do that.
This is your construction in geogabra; you can freely move the point C. The area strictly increases (thus changes) every time you press "GOGO RIGHT".
https://www.geogebra.org/geometry/arnemf9f
R= 3t i 3t^2 j 2t^3 k
https://www.geogebra.org/3d/xjgjxdth
You have to provide the bounds of the t for this curve if you wish to solve for the mass of the wire along the curve. Perhaps review the arc length formula and how it requires you to integrate the magnitude of the derivative of R with respect to t.
Thank you for the very thorough answer! I'm very new to multi variable calculus, so my reasoning behind trying to do this was not for practical purpose of calculating anything, but to see if the gradient vector could be expanded to three space in order to see the line tangent to surface at, lets say, (a,b,f(a,b)).
I currently don't have any material with me and have very limited experience with this concept, so bear with me:
Using the generic definition " Like the derivative, the gradient represents the slope of the tangent of the graph of the function. More precisely, the gradient points in the direction of the greatest rate of increase of the function, and its magnitude is the slope of the graph in that direction." If the gradient is representing a vector orthogonal to a level curve at point (a,b) and the magnitude of the gradient represents the slope (orthogonality indicated it is the slope of greatest ascent/descent) could it be said that the gradient in R^3 where the "tail" of the R^3 vector is at point (a,b,f(a,b)) would indicate a tangent vector where the projection onto R^2 would still be orthogonal to the level curve given at (a,b) when z=f(a,b)...
Actually, after typing it out and looking at this https://www.geogebra.org/m/nacGfYUR that doesn't quite make sense... Perhaps I will gain a better understanding when I learn some of its applications.
Well, I opened the file in Acrobat 2015 and it showed no Javascript in the file. So I went ahead and added a button for the first page only.
https://www.docdroid.net/BnWJ3pm/formulas-js.pdf Does the first page work?
This is the JS for the button: https://jsfiddle.net/n0L3vrjs/1/
Go into "Prepare Form" mode and you can add scripts for each page.
You didn't say what level of algebra you are interested in, but my guess is that you want something on the level of introductory college algebra. If that is true, I would recommend the Schaum's Outline by Moyer and Spiegel. Schaum's Outlines, in general, are good for self-study because they have a lot of problems and worked examples...and they are inexpensive.
Here is the Amazon link to it.
https://www.amazon.com/Schaums-Outline-College-Algebra-Outlines/dp/1260120767
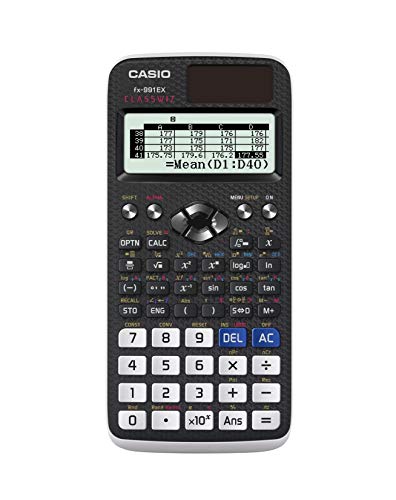
I'm not from the US so I don't really know what level grade 12 actually is but assuming you don't need a graphing calculator I would absolutely recommend this
For a scientific calculator this will do everything you need it to and more and has taken me all the way through to the final year of my degree with no issues.
Hello, sorry for the late reply.
I don't have the material yet, but I can describe how I plan on bulding it.
Essentially, it will use a simple folding shelf bracket https://www.amazon.com/Folding-Shelf-Brackets-Collapsible-Bracket/dp/B07KX1TWRL.
It will fold down flat on the wall. and bends at a 90-degree angle. Honestly, I could probably just eyeball it and get pretty close, but I'm curious if there is a better way to be sure I'm not over or undershoot my length target.
Hopefully, that helps. Let me know if there are any more questions I can answer regarding the small home project.
Kahn Academy has some good vids for Calculus I. I used www.thattutorguy.com during trig and it helped a lot so you could try it, but its not free like Kahn Academy. Youtube can also be very helpful. The best advice I could give though is: Never miss class (I did, worst decision i could of made), do all of the homework assignments with as much effort as possible, read the section before class and take notes and write down everything your teacher does in class (examples, theorems, etc.) this will not only help you during the homework but it helps keep you focused during class, if you don't understand something try to understand it immediately (talk to teachers, TA's, tutors, and other students for help), do homework the day it was taught in class, and turn it on time. I would also reading from (if you aren't already using it in the course) Thomas' Calculus Early Transcendentals (12th Edition), which can be rented for the entire semester from amazon for only 25 buck. It is very well written and reading from it will help you in my opinion, here is a link to it on Amazon.
I thought about the undefined problem, while thinking I could eventually eliminate them either by eventually changing to cotangent or other simplification.
I'm studying by my own, following this book. I'm on section 7.2 now (not open on Amazon).
No worries. I can leave this one for later.