
What is Reddit's opinion of
InfluxDB?
From 3.5 billion Reddit comments
➔ InfluxDB website
By popularity on Reddit, this Service is:
100 reviews of this app found across Reddit:
telegraf and chronograf with influx db
​
https://www.influxdata.com/time-series-platform/chronograf/
​
The client is in the packages already
That's what I was thinking. With the numerous open source projects, there is likely a solution out there that one person could use to do the same thing. Hell a TICK stack and a little bit of coding can have a nice alerting with historical data. Such as showing how many people are logged into a server that rarely gets logged into.
TICK stack is what I use fr tracking stats over time and Zabbix tracks what things need to be acted on right now. The TICK stack tracks trends over time and helps see if we need to increase drive storage, memory, vCPU's, and what not. I've also written a few scripts to send stats about ticket trends from our ticketing system to the InfluxDB.
The "cheap" way to HA with InfluxDB is to simply have telegraf to write to two different InfluxDB's. Ex: https://www.influxdata.com/blog/multiple-data-center-replication-influxdb/
Hey there,
I used Unreal for some neuroscience and physiology research at McGill a couple years ago. I started off by using CSV files. Now I'm helping out with a PhD project at the University of Central Florida and building a better methodology for gathering data.
I haven't finished documenting and explaining everything yet, but I started a Gitbook a bit back on how to set up Unreal Engine to work with InfluxDB and the TICK stack. https://calben.gitbooks.io/unreal-engine-as-a-research-framework/content/ Maybe tonight I'll fill in the blanks. Before diving into it though, you should read through the TICK stack to see if it would be appropriate for your work. https://www.influxdata.com/time-series-platform/ It lets you create nice dashboard for your data automagically, but it also means switching to using a proper database, which can unnecessarily complicate matters. If you wanted to just output to a CSV file, I've also done that a few times, and I may be able to dig up the old code for doing it or just explain how to most easily do it.
If you wanted to use the UnrealInfluxDB Plugin, you can check out the demo project here: https://github.com/calben/UnrealInfluxDbDemos I'll check later today whether it has any issues and maybe update it a little, and if you have any questions about it, I'm happy to help out (my email should be pretty easy to find).
Overall, I find Unreal works very well as a research tool. On top of the lab work, I also created some floorplan testing tools for work that tracks a bunch of user data and streams it to a tablet for viewing so that an individual can view both what the user sees and the data gathered on them. It was pretty easy to get that set up too :-)
I can second the ELK stack for logging, although I'm currently investigating rsyslog as a replacement for Logstash.
Our monitoring stack is collectd + riemann + influx + grafana which is a lot of fun, but also a lot of cognitive overhead. If I were starting from scratch and wanted to keep it simple, I would definitely look at the TICK stack for the monitoring piece.
I do think it's worth treating logs and metrics as separate kinds of thing with different requirements, rather than trying to use one piece of software to cover both.
I'm working on an intermediary proxy for InfluxDB to apply intelligence to metrics before passing them on to the actual database. Version 0.1 goals include routing metrics to different InfluxDB servers based on measurement names or tag values, and "massaging" the data itself, initally just providing the ability to strip tags from the metrics.
I'm using Actix as the web framework and Nom to parse the metrics. This is my first real project in Rust and it's challenging, but I'm enjoying myself immensely.
First would actually be to google.
https://www.influxdata.com/blog/how-to-use-grafana-with-influxdb-to-monitor-time-series-data/
Plenty of info out there but if you have actual questions ill be happy to answer.
Neither, I would use Prometheus or TICK.
The problem with check-based monitoring:
- They're too host centric.
- They don't track the status of applications well.
- They don't do well in VM/container environments with high variability.
- They don't use a metric data driven approach to alerting.
- You still need something else to get status graphs.
Metrics-based monitoring is what you really want.
https://www.influxdata.com/products/influxdb-cloud/
There's a free tier which should work for a POC. No manual shard balancing and the Cloud offering is elastic- I think they have an open source version as well.
You’re describing a time series database. Use something off the shelf. The one complication I can think of is that when you get down to “daily” granularity, you probably want to store the closing price for the day - not just the mean of all the shorter intervals. There may be a TS DB that allows you to control that, or you may just want to store daily close prices separately.
I everyone, I have just published an article about this: https://www.influxdata.com/blog/influxdb-latest-tag-updated-in-docker-hub/
It offers a couple of ways forward if your deployment was unexpectedly upgrade to InfluxDB 2.0, either upgrading your data to work with it or rolling back to 1.8. It also explains what happened to cause this, and how to avoid it in the future.
You might be able to do what he wants without Grafana. Influx has a query language that you might be able to invoke via D3.js (about which I know ZERO!). The neat thing about Influx is that it is time sequenced automatically plus it is “schema free” ie you don’t have to define a schema in advance and can change/add as you go.
I don’t imagine your DB content is very complicated so the relevant query to get the barchart data should not be too hard.
https://www.influxdata.com/blog/data-visualizations-with-influxdb-integrating-plotly-js/
But I now stray dangerously into going beyond helpful to seeming to tell you what to do!
You need to research Telegraf & InfluxDB at a minimum, I suggest the full TICK stack. Can start here: https://www.influxdata.com/time-series-platform/telegraf/
I think your friend is refering to keeping the data in a 3rd normal form (3nf), which may be best practice in some applications.
In your case i dont see any reasons why you should store data in 3nf, but I think it would be beneficial to do some researh on 1nf, 2nf and 3nf. There are also other schemas used in other applications (eg: datamining) such as 'snowflake' and 'star'.
Apart from all this you may opt to use a time-series database, if you are planning to query data based on time (eg: rolling window mean). These DBs are specifically optimised to handle time-series datapoints. I would suggest InfluxDB (open source), if you opt for a time-series DB.
References:
https://www.guru99.com/database-normalization.html
How about Prometheus or InfluxDB. Both are open source and a lot more efficient than Zabbix. A lot has changed in the open source monitoring space in the last 5 years.
You should consider influxdb or other TSDBs. 225 events per second is pretty much nothing for those databases, however they have drawbacks such as very poor update capabilities, and somewhat limited query capabilities.
I'm not exactly an influx fanboy, but I do recommend it, plus it has things like kapacitor, which is essentially a stream processing framework.
I personally use influx in my projects, however we've also dedicated some time to get a zeromq based pipeline setup. I was first turned on to ZMQ when I read CERN was using it, and it works exactly as advertised, and has really good performance. The main paradigm on ZMQ that is worth its weight in gold is the PUBLISHER/SUBSCRIBER protocol, which allows you to create pipes of data which you can then send in and out of your programming language of choice, or even use as a splitter to send to influx for display in a dashboard and S3 containers containing highly efficient HD5 files or whatever else; using the latter for offline data analytics.
For performance data, I usually start with metrics collection. But it depends a bit on how long these tasks run for.
If it's something that runs for a few minutes, you could still do performance metrics collection with something like Prometheus or TICK Stack. Both can collect data at the second level and store the data for months to years.
If it is really short-lived, for less than a minute of run time, you'll want to emit metrics data at the completion of runtime and store those somewhere.
EDIT:
Thinking about this more, what language is the application written in? What you really want is direct instrumentation in the application itself. This is the only way to really get insight into what it's doing.
Check out TICK https://www.influxdata.com/time-series-platform/
Lots of quick setup guides googleable to get started. Can be extended with other free products. Positive improvements in the recent releases.
https://www.influxdata.com/blog/how-to-send-sensor-data-to-influxdb-from-an-arduino-uno/
This is what got me started. It doesn't focus much on the influxDB side but there is a ton of information out there regarding that and displaying the data with Grafana.
As you say, Chronograf is designed to work exclusively with InfluxDB (TICK) and it has come a long way in the last 9 months (since you last used it)! The newest version includes tables (as a visualization option), and Influx just came out with a log analysis release. InfluxDB, however, also works really well with Grafana for dashboarding, and there are a number of people using Telegraf + InfluxDB + Grafana.
For memory an cpu can use the tick stack to monitor all your mac, it is open source and easy to setup. A basic setup would pretty much do what you need out of the box with a low footprint on your monitored machines.
Monitoring, always monitoring. For SRE/DevOps monitoring is the first thing, like backups are the first thing for sysadmins. If you don't have monitoring, how do you know if chef/terraform/ansible didn't just destroy your app? :-)
I usually recommend Prometheus. But the TICK stack is also reasonable.
Hi, Prometheus developer here.
Of course, I have not always been a Prometheus developer. Way back in the day, in the early 2000s, we were using Nagios. It was cool, sent us pages, sometimes in storms, but it was better than nothing.
I worked for a very large company for a while, but in 2013 I went to work for a startup. To my surprise, they were using Nagios. I hadn't realized that it was still a thing.
I tend to put Nagios, Zabbix, PRTG, and Icinga2 all in the same category. They're check-based monitoring. This is by far the worst way to monitor things. They run "checks" on a periodic interval, and mostly ignore what happens in between those checks.
Prometheus, InfluxDB (TICK stack) are metrics based. Instead of running checks, they collect metrics data, usually in the for of incrementing counters of events. This allows you to graph the metrics. It also allows you a very powerful way to alert on the data.
Things you can easily do with Prometheus that you can't do with checks:
- Alert on a percent of servers/services being down, rather than individual servers/services.
- Alert on the rate of change of a service.
- Do predictive alerting rather than thresholds. "The disk will be full in less than 4 hours" or "The temperature in the server room is going to be over 40C in 15 minutes".
The reason I joined the Prometheus project was out of pure joy in finding a monitoring system that gives me visualization data and alerts based on that data. No more faulty checks that don't catch problems and deliver pager storms.
Benchmark is not loading 1GB file at once. It streaming it line by line with some limited buffering. Akumuli uses the same approach as InfluxDB here. I've actually written about OpenTSDB protocol in the article. OpenTSDB can really benefit from the same protocol deduplication technique. InfluxDB folks showed recently that OpenTSDB is slower using the same benchmark - https://www.influxdata.com/influxdb-markedly-outperforms-opentsdb-in-time-series-data-metrics-benchmark/ and I found the reason why this is the case.
We are trying to move off of Datadog and onto some other type of system. It is somewhat expensive once you start adding a lot of hosts and custom metrics, we have had issues with their service being down or having problems, and their integration with CloudWatch metrics isn't great. I understand that ingesting large amounts of data from many sources is difficult but they have fairly frequent incidents: https://twitter.com/datadogops
It was great when we were starting out, having UIs to manage all of our monitors and alerting but the API and query language isn't all that great/documented at least a few months back when we were trying to make good use of it.
We have ELK for logging, again looking at other options.
Now that we have a chance we have been making a move to InfluxData's TICK stack https://www.influxdata.com/. Not as fleshed out as DataDog's feature set and a lot more DIY but so far it looks pretty powerful. Also doesn't have a UI for creating monitors. We use Grafana for viewing of metric data, and apparently Grafana 4 has alerting! http://grafana.org/
I would really suggest using a time series database (TSDB), as it's what they are intended for. I'm partial to InfluxDB, but that's just because it's what I started with for saving sensor data.
Sensu, Influxdata's tick stack, and Graylog.
These are the new, but quite powerful, shiny thing in monitoring. We're using them now and it's awesome what you can put together with it.
One suggestion that I would add is to use Grafana instead of Chronograf (The 'c' in the tick stack.).
edit: Added Graylog to cover the syslog and app logging side of things.
I don't know how I'm supposed to grade this thing you've produced -- there's no rubric offered. It doesn't look completely bonkers off-track I guess? The content sure does seem "computer science" flavored? You got some micro-controller ecosystem tools sprinkled in there?
Looks fine, but I frankly I don't think that opinion is worth much.
I think getting the controllers to surface data, and collect that data, is the absolute easiest part of this idea. Prometheus and InfluxDB/Telegraf both exist and their client libraries can run on a frickin toaster.
For a similar use case I also used the excellent N8N but I ingested data into InfluxDB which is much better for time series data than Postgress. You can send data to it just by making a POST request which is super simple from N8N with the templating language.
To view graphs I used Grafana since I already had it up and running for metrics. It's good for simple charts but it does have is own limitations and I think that metabase can give much deeper insights.
My choice was check_by_ssh
One nice thing about the switch is that updating a service definition on the monitoring server activates the change immediately rather than having to update an .cfg file under /etc/nrpe.d/ on each system (and the associated change management processes)
For security purposes, I like the idea of something like telegraf where the results would be pushed to a monitoring server instead of being polled. Nagios and forks have passive check functionality for this mode of operation, but it looks like it would take more custom work to get set up.
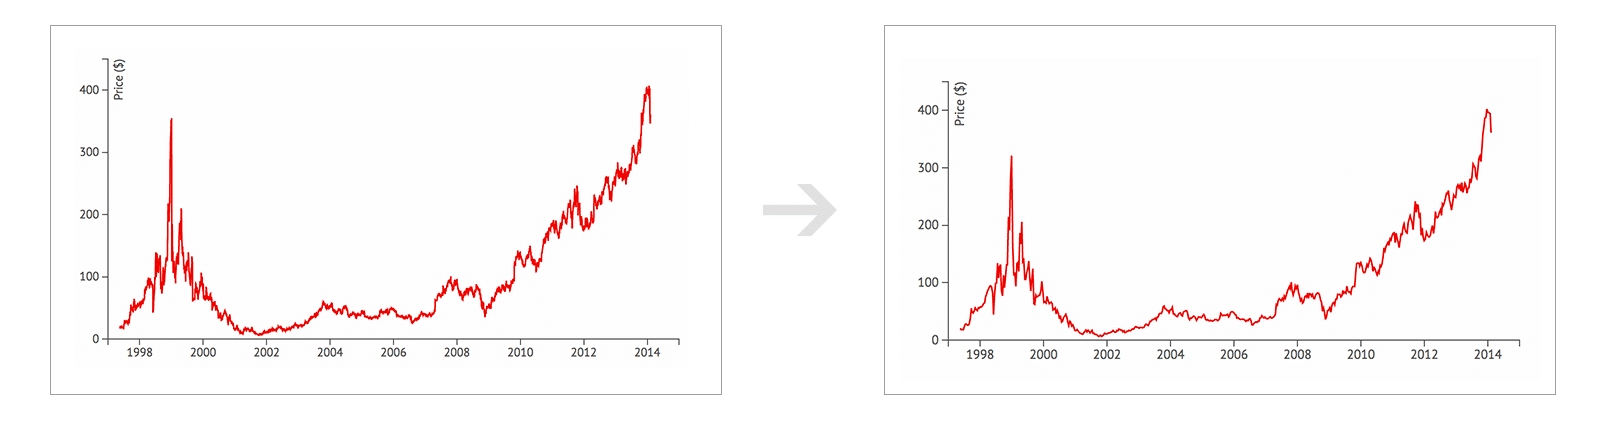
The thing about classification of something like food is that there are no clean boundaries, it's a continuous mess that we are consciously adding categories and borders to that weren't there before. I'm sorry I'm bringing maths into this but I think of it as continuous vs discrete data points: something like the chemical elements form a discrete pattern where each one has a different specific amount of protons with no points in between, so you can pretty easily just divide the data up in those discrete points when classifying it. On the other hand, with continuous data points you always have to draw arbitrary categories based on our personal judgement and say and say ok the graph is continuous but it spikes between roughly 1998 and 2000, even if no such limit existed in the data. Food is the same: technically cooking is just combining a number of edible substances and using one of a number of chemical and mechanical processes turn them into something we eat, and there are no natural categories or limits in this, we are the ones who arbitrarily say that roughly these proportions of these substances treated this way fall into a category, so talking semantics like this imo really misses the point because what you are doing is looking for objective defenitions and limits to objective categories, even though they don't exist in the first place. Food categories are always going to be inconsistent and overlapping and not cover everything and change from person to person because they are arbitrary cultural inventions from the beginning and not objective.
A change to the Telegraf docker images was made to run telegraf not as
the root user. This unfortunately meant that users could not install any
new software. New Telegraf images are now published that allow users to
again install additional software to the images. Telegraf itself is
still run as the telegraf user/group, but users have access to run things as root in order to configure the image. We have a full post on why we made this change and the impact to users. Thanks!
Thanks man I appreciate it.. I just wanted to bring more visibility to these systems & data... I use these tools for monitoring and metrics of IT systems normally.. And I couldn't find any good visualisations that showed this data.. (here's an an article explaining timeseries databases https://www.influxdata.com/time-series-database/ )
Not sure what the goal is... I guess I reached my goal mostly by importing high resolution wind data for most of the continent ... I could register domain for it or add more grid data to it ... Also can do more work on dashboards etc... Some graphs take 20+ seconds to generate which is a bit of a problem.. Also setup automated real-time ingestion .. Maybe GitHub repo that allows forking and contributions?
Also I'm a bit conscious that it's running it on my home network should move it to the cloud at some point.. but I think I've done OK job with CloudFront CDN and setting it up securely..
And if you have any requests or spotted anything interesting in data do share.. :)
You can easily send the data to an InfluxDB server with the InfluxDB library for ESP. Here's a post on how to implement it.
Announced November 2020, and according to their github repository still in the early development stages, not ready for testing and undocumented.
And that's all fine and good, and I wish them the greatest success, as competition breeds excellence. Rust doesn't suck, I just find it weird that I can find so many more successful Go projects that are clearly in the domains Rust is touted as being designed for.
Check out Prometheus, Or InfluxDB
They both are complete open source performance monitoring suites, and don't differ too much in their features.
Both include relational databases that have their own db schemes based on timestamps, tags and fields.
They got their own query languages like PromQL or Flux.
They need some time to get used to, but once you know them, it can be really powerful. For example you can, select, filter, pivot, aggregate with math operations, time windows, periods all in one query. You can also setup alerting, jobs, scripts and write your own functions.
Another feature is, they come with an UI for querying, graphing, administration, etc.
I prefer openSUSE,especially leap.
[https://get.opensuse.org/leap/]
Software to run: NFS/CIFS/SMB server.
wiki.js.[https://js.wiki/]
Unbound/BIND -Using hblock and oisd blocking lists.
The TICK Stack (Telegraf, InfluxDB, Chronograf and Kapacitor) or the TIG Stack (Telegraf, InfluxDB and Grafana)[https://www.influxdata.com]
Shadowsocks.
Wireguard.
paperless-ng docker container.
Keepass.
sent you a message with the details of what the code looks like and what I have been using for years.
Here is another link with similar code..
https://www.influxdata.com/blog/how-to-send-sensor-data-to-influxdb-from-an-arduino-uno/
> The site gets a LOT of unwanted traffic. About 5-10k requests per day.
This is basically nothing. You're talking 0.01 requests per second. A normal flask app server if it's not completely messed up should easily handle 100 requests per second. That means your average 7500 requests/day is 0.001% of your capacity. You're lucky to have such low volume backround noise.
> At certain times I see the CPU usage rise to 100%
You need metrics-based monitoring and logs. Something that will tell you what containers are using what CPU time when. Something like cAdvisor is a good tool. It can monitor the CPU use of docker containers and systemd units. (Set DefaultCPUAccounting=yes in /etc/systemd/system.conf)
Once you have metrics, you can then correlate the CPU behavior with your nginx/flask logs.
You probably also want to monitor the OS, something like the node_exporter or telegraf can be used to gather data about the memory utilization, network traffic, swap activity, etc.
I use the MQTT Consumer Telegraf Input Plugin for this. Telegraf is a tool which allows you to read data into InfluxDB (a time-series database which is supported by Grafana) through plugins. Basically the plugin allows you to subscribe to different MQTT topics (even on different brokers) and put those in the database, which you can then graph using Grafana.
Did not quite understand your “package deal docker container”; but what you can do is on the rpi where you have grafna & influx, you can enable telegraf (its should already be there with grafna). But anyways you configure the telegraf.conf file with your snmp traps. You just point your trap to your edgerouter and the oids you want to trap. The snmp output points to your influx db. Ofcourse you need to enable snmp in edge router etc. Here is the details on snmp poller: https://www.influxdata.com/integration/snmp/ ⠀
To play around your can install snmpwalk on rpi and trying hitting the edgerouter oids and check if that gives you the data you need. Some MIB discussions for edgeos is here : https://community.ui.com/questions/Edgerouter-MIB/1897dda4-0c25-4a85-935e-3ed527fab943
I recently made this script to deploy the Telegraf metrics agent to Windows systems.
This is primarily designed for Windows Server but can also be pushed to workstations.
All information can be found in the readme, but, in short, the script will install/update:
- The Telegraf agent.
- Base configuration for the output plugin.
- Default system metrics input plugin.
- Active Directory Domain Services metrics input plugin.
- DFS Namespaces metrics input plugin.
- DFS Replication metrics input plugin.
- DNS server metrics input plugin.
I am happy to add further input plugins upon request; please raise an issue or pull request, ideally with an example Telegraf configuration.
This article may be helpful in your quest:
​
https://www.influxdata.com/blog/influxdbs-checks-and-notifications-system/
Not by itself, no, it lacks an true SNMP polling feature. What you can do however, is use something like telegraf to do the polling, then have telegraf send the metrics into Splunk via the HTTP Event Collector which Splunk can then index into a metric index. You can then do all the typical Splunk stuff with the data like dashboarding, alerting, reporting, etc.
We use this exact setup to monitor our datacenter environments from our CRAC units which works pretty well.
Finally realized that today is First Contact Day in the Star Trek universe (where humans first made contact with aliens): https://www.influxdata.com/blog/first-contact-day/ It could’ve been DFV signaling something was going to happen on the 5th (today) or just him geeking out, or maybe indicating once again that GME will rocket and take us to the next universe 🚀
Edit: forgot to mention of course that he might really be an alien.
This is a times series data stream, so using a database designed to handle this type of workload would be the ideal.
Since you are using Python, I would recommend using InfluxDB. I included a link below to get you started.
Once you implement the data logging part, is a very easy step to take the data from InfluxDB and use Grafana to visualize the data.
https://www.influxdata.com/blog/getting-started-python-influxdb/
And if you use Docker, getting both InfluxDB and Grafana up and running is a breeze using their ready-to-go container images.
TICK is good.
Telegraf has OS probes and pushes out metrics, has very low overhead and uses less resources than prometheus and it's "pull" based scrape system.
InfluxDB is quite heavy though, so be sure to host it away from your resource constrained environment. Alternatively telegraf can sink to other databases. Good luck.
I'd dump the sensor data into a time serries database like influxdb.
Incidentally, influxdb also comes with customizable dashboards for displaying / graphing data.
Telegraf, ntopng and remote syslog out pfSense. inFluxDB to get Telegraf and ntopng data, GreyLog to get syslogs. GreyLog and inFluxDB to have a perpetual play date together; https://www.influxdata.com/blog/graylog-monitoring/
Grafana, Chronograf, NetData whatever you want to use to visualise. Little effort to setup, but is literally a set and forget solution. Have over 1 years of metric, log and incident data from my (among many other things) pfSense.
I'd suggest the following.
1.telegraf+influxdb configuration
2.set up a telegraf http listen module and set the format to json
3.alter the ps script and dump the table using [convertto-json] cmdlet(format the object as instructed in the document)
4.Post telegraf url with the json contemt in the body field with [invoke-webrequest] cmdlet
5.setup the grafana to read the influxdb
Further instruction as below https://www.influxdata.com/integration/http-listener-v2/
Hope it helps.
This is a fairly straightforward setup. Configure Telegraf to poll your kit with SNMP and write to a DB in Influx. Then add that DB as a data source in Grafana and you can start drawing the graphs.
This guide from Inflix might help you get started with the SNMP polling. https://www.influxdata.com/blog/monitor-your-snmp-devices-with-telegraf/
Might be too complex, but maybe take a look at Chronograf/InfluxDB/Telegraf. It's not super simple, but I've got it running really nicely without too much trouble, and it does the job brilliantly.
Take a look at https://www.influxdata.com/blog/running-the-tick-stack-on-a-raspberry-pi/, then look at configuring telegraf to grab syslog data: https://www.influxdata.com/blog/get-your-syslog-on/
Yup, you need a database. Looking at the dataset size (I'm guessing little to no normalisation), maybe a Time Series DataBase would be a better fit?
https://www.influxdata.com/time-series-database/
https://www.guru99.com/database-normalization.html
You either have money (pay somebody to pick the tools & design the DB) or you have time (learn about these technologies yourself). Getting started without understanding some of the basics will result in astronomical cloud provider bills and very little progress.
There are many ways. One way, that some prefer, because they want to be "selective", can be found here: https://www.influxdata.com/blog/monitoring-windows-services-with-grafana-influxdb-and-telegraf/
There are full monitoring packages like Checkmk that also allow you to setup windows perf counters to be monitored. The Checkmk approach merely uses config files and its agent. Simpler to setup than the above, but more targeted at "full" monitoring of hosts of a network.
Edit: when I say "simpler to setup", I mean assuming you've got a Checkmk infrastructure going already.
Depending on the use case, BigQuery can be a great time series DB. Firestore and Firebase are a bad fit for time series data in my opinion.
Also using a third party InfluxDB provider like this one: https://www.influxdata.com/products/influxdb-cloud/gcp/ might be a good choice
Write a python script to grab the data and write it into your influxdb, then setup it up as a cron job. Here's an article that explains how to use python to write to influxdb.
If you're storing monitoring data you probably want to look at Prometheus or InfluxDB which are time series databases that store data points at configurable resolutions with expiry.
You probably only need minutely data for a week, maybe two. Time series databases can resample the data to lower resolution, maybe 5-minutely for the last two months, then expire or resample to an even lower resolution for long-term comparisons.
No it's not going to be quick, but storing minutely metrics into a relational or document database is going to shift your maintenance burden from code messiness to database performance.
If you'd rather buy than build you can look at [https://datadoghq.com](Datadog)
I'm not aware of anything built for this purpose out of the box, but this story inspired me to set this up.
I use the InfluxData TICK stack https://www.influxdata.com/time-series-platform/ to monitor and perform automations for my home setup. I ingest SMART data, among other vitals, every 5 seconds. That should be sufficient resolution to catch an anomalous temperature spike that will rise above operating parameters and then execute a slack alert and preventative poweroff.
AWS Cloudwatch may be overkill for your case. Are you willing to share more details for your app?
Initial thought is implementing InfluxDB but dependent on the data being collected.
Home assistant: you can use the file sensor with value templates to accomplish this. InfluxDB: check this
We're using ControlUp along with some custom dashboards we've built using Telegraf, InfluxDB and Grafana. Grafana is awesome for building dashboards to get a real-time, holistic overview of your environment. Hypervisor, storage, OS, cloud provider, NetScaler, Delivery Controllers, StoreFront...all in one spot.
There is also a great PowerShell module, PowerShell-Influx, that allows you to write data from PowerShell to InfluxDB. I find this handy for visualizing data that can be pulled through the Citrix PowerShell modules.
Graphana is kick-ass.
You need to install a back-end data store, like InfluxDB. Then install a data collection agent, like Telegraf. Then Graphana takes that data and displays it to you in a myriad of ways.
Once you have it setup, the sky's the limit. You can setup agents to collect data from just about anything. Like other devices on your network, such as your Internet modem, routers, etc.
You might enjoy integrating TICK stack for your project as described here: https://www.influxdata.com/blog/getting-started-python-influxdb/
In this regard, you can spin up Docker (or podman for that matter) containers in a few steps per: https://github.com/influxdata/sandbox
Aside from that approach, perhaps only query your db at regular intervals spaced out by either 30/60s and able to be manually refreshed by a browser client.
Cool, in my case it's: sensors read by Home Assistant, writing to InfluxDB, being pulled into Grafana.
https://www.home-assistant.io/
All open source, and there's plenty of easy-install, Dockers etc. for them here:
I would recommend a time-series database like InfluxDB. This is the definition of a time-series database from Influx's website:
>A time series database (TSDB) is a database optimized for time-stamped or time series data. Time series data are simply measurements or events that are tracked, monitored, downsampled, and aggregated over time. This could be server metrics, application performance monitoring, network data, sensor data, events, clicks, trades in a market, and many other types of analytics data.
Apart from good support for time-series data, another advantage of InfluxDB is its integrations with visualization tools like Grafana, which spares you the headache of coding a web page. I have personally used InfluxDB with Grafana to visualize live requests to our application (as part of our monitoring stack). Both of them are open-source projects and have strong communities.
I know this could be somewhat overwhelming, but it will certainly be fun. You can start by setting up Influx and inserting your sensor data in it with a Python script.
https://github.com/influxdata/influxdb-python
Feel free to ask any questions.
Influx ram usage scales with the cardinality of your data, unless you use the TSI storage engine
https://www.influxdata.com/blog/how-to-overcome-memory-usage-challenges-with-the-time-series-index/
Flux supports months. If you're on InfluxDB 1.7 or InfluxDB 2 - you can do this.
​
https://www.influxdata.com/blog/aggregating-by-months-or-years-in-flux/
An alternate option to expand on what @sup3rlativ3 mentioned would be SNMP Telegraf plugin, and pull the metrics from SNMP. It is light weight, and you can get a lot of good data just from the default MIB sets for Linux. Syslog will not necessarily log things like disk space, load, or Ethernet utilization so it also depends on what you want to graph on your dashboard.
You need to send data to your database. You can do this in various ways. One mehod is using Telegraf
But I would recommend you to lookup some guides
Their docs are really good and they have a self pace "University" on their site that is full of good videos and posts. The videos are good to use to get a high level feel. https://www.influxdata.com/university/
Those are all free and then their stack is free and easy to start trying things on a Linux VM (also free).
Can you give me some more detail about your schema? If each temperature is in different measurements, you'll have to use Flux to do joins across measurements. Then you can do math across measurements. https://www.influxdata.com/blog/influxdb-how-to-do-joins-math-across-measurements/
InfluxData is hiring a number of different roles. We have open Senior Site Reliability Engineering roles and a number of Continuous Delivery engineering roles focusing on our cloud products. Options for remote employees in various US states and countries.
SRE: https://www.influxdata.com/careers/#senior-site-reliability-engineer-availability-group
CI/CD: https://www.influxdata.com/careers/#senior-continuous-delivery-engineer
We have more openings that can be found here: https://www.influxdata.com/careers/#
P.S, Awesome place to work with a great culture and supportive teams!
I believe this is the guide I was following: https://www.influxdata.com/blog/running-the-tick-stack-on-a-raspberry-pi/
Data flow is this way, more or less:
I'd say install just Telegraf on computers you want to collect the data from, then change /etc/telegraph/telegraph.conf to point Telegraph to an InfluxDB instance on the box you will be storing the data on.
Chronograf and Grafana are similar, it's up to you to choose what's more convenient for you.
https://www.influxdata.com/time-series-platform/ - Telegraf, InfluxDB, Cronograf, Kapacitor. It's a time series database ecosystem. It's compatible with others - for example, you can use Grafana instead of Chronograf. Can pull data from a lot of sources - https://docs.influxdata.com/telegraf/v1.11/plugins/plugin-list/
OhmGraphite is for Windows, yeah, but there are other options. There's stuff like Telegraf which can collect system stats - not quite in as much detail as OhmGraphite - but it's what I'm running for my the two Raspberry Pi's I've got (one running InfluxDB, Grafana and Raspotify + one running Pihole) and it's enough so far.
Hrm, according to the docs I've seen, InfluxDB supported uint64 for a while now (Since 1.4). I think there were some config issues where it was off by default.
Yea, it was preview in 2017. I'm pretty sure it's on by default now.
Access really isn’t the right tool for this either. It does have some limited reporting functionality, but it sounds like you need straight up data analysis. I would suggest python, Matlab or a time-series database like InfluxDB
Yup, learning one step at a time is a great attitude.
Sometimes it does help to have a tutor for completely unfamiliar things. For example, a number of years ago I was thrown into a situation where I needed to become an expert in MySQL in a hurry. I had more than 15 years experience as a systems engineer at the time, and had extensive experience in warehouse-scale computing.
But I knew jack squat about running MySQL at scale. Playing around with a simple LAMP stack app isn't enough. So my company hired a MySQL performance consultant to go over our setup and teach me some of the finer points of MySQL. I also read as much as I could from the Percona performance blog.
It might be worth it to hire a good *NIX/Linux systems engineer as a consultant to dig into your system and help you learn more. It can cut down the ramp up time to figuring things out.
As some other people have pointed out, you need performance monitoring. The SRE Book has some good info on this.
Shameless plug/disclaimer, I am a developer on the Prometheus monitoring system. It's a good place to start to get full real-time monitoring of the system. The TICK Stack is also a good option.
You should be able to use flux on v1.7.6, That will allow you to do a join.
Here are some examples.
https://www.influxdata.com/blog/influxdb-how-to-do-joins-math-across-measurements/
You have several layers of differing requirements.
First, you probably want something like a full metrics monitoring system. For example Prometheus and InfluxDB are modern systems for collecting and pulling in data from an entire network. For example, the snmp_exporter can be used to translate SNMP data from all your devices and load it into Prometheus for viewing.
That will give you port-level information.
For IP-level traffic analysis, you need to start doing Netflow/IPFIX analysis. This requires a different set of tools, which I don't have a nice simple answer for. The open source tools in this space are not so great.
IMO, use the right tool for the right job. Don't try and shoehorn "one tool to rule them all" into a situation that needs multiple tools that do one job well. For example, Netbox is exactly the right kind of source of truth IPAM. Trying to find one tool will end up being great in some areas, and awful in others.
For a monitoring network that large, I would probably look into a distributed capable metrics-based solution to replace something old-school like Nagios. For example, Prometheus or the TICK Stack. Both can be setup to easily scale to 10x what you're doing now. You can drive the monitoring from the data in Netbox.
Disclaimer: I'm a contributor on Prometheus.
> my company (who is looking for FREE)
The only "FREE" options here are open source. Anything commercial and free for monitoring is doing to be demos.
> Currently Cacti and Nagios together are not scalable which is imporant these days.
You'll have to step out of the typical r/sysadmin suggestions to get scalable and open soure. Look at what the "devops" people are doing.
Both are open source and designed to scale to huge operations.
Disclaimer: I'm a contributor on the Prometheus monitoring system.
TimeShift is possible with Chronograph:
https://www.influxdata.com/blog/release-announcement-chronograf-1-4-0-telegraf-1-5-1/
Basic arithmetic is available on timestamps:
https://docs.influxdata.com/influxdb/v1.7/query_language/data_exploration/#time-syntax
So you can do timestamp - time() to calculate the difference.
You could SUM those differences together.
Flux will make a lot of this easier, over time 😃
The new kid on the block which might compete with ELK, is TICK:
https://www.influxdata.com/time-series-platform/
And it can also handle logs:
https://www.influxdata.com/blog/writing-logs-directly-to-influxdb/
For the love of ${deity}, it's 2019, you shouldn't be implementing new Nagios installs anymore.
ELK might work, as would Prometheus, or the TICK Stack.
Also as others say, Monitoring and Management are two things. Use the right tool for the right job. You don't want one tool that does both badly.
100% bias, because it's what I use/work on. :-)
Prometheus is the best metrics-based monitoring tool out there. The TICK Stack is also good.
I don't know anything about BigIP devices, but someone wrote an exporter for bigip devices using the device's API. Might be worth playing with.
The best way to monitor them is to have monitoring software. For example Prometheus or the TICK Stack.
Are you not running the script in a systemd service or timer? Also, why a custom script and not something standard like the blackbox_exporter?
The default retention policy isn't truly infinite. It simply matches the shard group duration, which defaults to 1 week.
You might want to read this.
Stop using scripts for monitoring, and use a proper monitoring system like Prometheus or the TICK Stack.
These systems collect data via metrics APIs. There are monitoring agents/plugins for both that can monitor applications, OS level stuff, and network devices via SNMP.
Got a VM running (via the freenas webgui) with ubuntu (anything else will work too), that has influxdb installed, telegraf (from the same people as influxdb https://www.influxdata.com/time-series-platform/telegraf/) with a mqtt adapter.
For mqtt I run a mosquitto broker in the same vm.
​
​
Ah that's neat :) I'm not too experienced with databases personally, is that more of an SQL feature?
I have seen InfluxDB seems to address my concerns in a similar way if it's an appropriate database for statistical queries(I think that's what I'm discussing here, such as likes or upvotes to score/rank content to viewers).
https://www.influxdata.com/time-series-platform/influxdb/
> InfluxDB can handle millions of data points per second. Working with that much data over a long period of time can create storage concerns. InfluxDB will automatically compact the data to minimize your storage space. In addition, you can easily downsample the data; keeping the high precision raw data for only a limited time, and storing the lower precision, summarized data for much longer or forever. InfluxDB offers two features—Continuous Queries (CQ) and Retention Policies (RP)—that help you automate the process of downsampling data and expiring old data.
I can relate, for sure. For me, it's about reducing scope - I'd like to have all the shiny toys and all the features, but I draw the line at the single server for now. And I don't need an aggregator, just my own posts.
Also, not a huge fan of kubernetes, I think it's really complex. Food for thought on that https://www.influxdata.com/blog/will-kubernetes-collapse-under-the-weight-of-its-complexity/
Is "rain_total" your measurement in this case? You have it listed as entity_id which I assumed is a tag. Generally the SELECT statement within the CQ follows the below format:
SELECT <function[s]> INTO <destination_measurement> FROM <measurement> [WHERE <stuff>] GROUP BY time(<interval>)[,<tag_key[s]>]
Check out the documentation for more details. Alternatively, if you don't want to use CQs to downsample your data, you can also create a task in Kapacitor to handle that. This post talks more about using continuous queries or Kapacitor tasks.
Sounds like a good use case for Graphite or InfluxDB actually. Both are fairly popular for monitoring of all kind which might be useful for your use case. You will probably need to profile it anyway however.
I don't like Cassandra for this. At least not when you specifically need time series data:
https://www.influxdata.com/blog/influxdb-vs-cassandra-time-series/
Cassandra is great for heavy writes, eg. Reddit uses it for upvoting. But that's not exactly what you are looking for.
It really depends on what you want to do with the data. And even then, for most purposes a relational database with the good data schema would be just fine.
With that in mind, for funsies, if you're planning on doing analytics based on the timestamps in some way, you can play with time-series databases like InfluxDB but its definitely overkill for the amount of the data I would expect a normal household would produce.
I'm pretty sure you can use InfluxDB's continuous queries for this. Grafana doesn't have a UI to help create the queries, but I think it's basically:
Create a continuous query that does your downsampling. See this or other guides: https://www.influxdata.com/blog/continuous-queries-in-influxdb-part-i/
Use Grafana as per normal, just targeting the continuous query data source instead of the raw data
(Note: I haven't done this myself! But have been meaning to switch some of my graphs to use it)
Not really related to hoarding, but I used Node-RED to get sensor measurements from custom IoT devices (more like LoT, LAN of Things) over CoAP and shove them into InfluxDB. Currently replacing that with simply Prometheus directly polling the devices.