
What is Reddit's opinion of
Coinigy?
From 3.5 billion Reddit comments
➔ Coinigy website
By popularity on Reddit, this Service is:
100 reviews of this app found across Reddit:
The markets travel in waves. What we just saw happen the last week or two was a complete market cycle. The correction that is happening now is a normal (and healthy) pullback. Instead of worrying, a well disciplined trader would buy MORE since it is so much cheaper, therefore lowering their cost per coin average.
Just a heads up, it may continue down a tad bit more before resetting for another cycle. This gradual downtrend has happened after every wave. Breaking that resistance (downtrend) with good volume coming in, would be an indicator of the reset of its market cycle.
XRP forming an ascending triangle + cup and handle on the hourly.
Very good chance of this breaking up and going to $1 mark, given the coinbase rumours.
Here's 2013: https://www.coinigy.com/s/i/563a9260/
It fell a lot more in one day...
And no, I'm not predicting this "bubble" to take off after this event neither. But there are comments making fun of people comparing it to 2013. If you ask me, this falls right in line...
EDIT: Here's now: https://www.coinigy.com/s/i/563a936d/
You guys excite easily :)
I'm going to print this and put it on my wall as the biggest pump and dump in history. These are 5 minute candles that are each a 20% swing: https://www.coinigy.com/s/i/5a08000472a99/
Bittrex was already glitching out and even Binance went down from all the heavy traffic trading BCH. Then... Bithumb went down and that's probably the main reason why Bcash couldn't go higher since all the manipulation was being led on there. I hope some good guys were DDOSing bithumb.
Beware meme factor of Cboe XBT expiration 14 November today. Also, my 3Day chart: we were rejected from MA200 but unless the old faithful EMA200 (~$6250) has turned into insurmountable resistance this is just chop/fuckery imo.
I don't really share my own personal TA often but VTC is one of the few I keep my eye on... and last night I had drawn this descending triangle and was keeping an eye on it ... and the damn thing broke so clean, it's nice: https://www.coinigy.com/s/i/5a22dc2c42fb5/
Now all we can hope for is for BTC to go sideways and be merciful on us altcoins.
DNT is the new kid on the block in a bull market. Evidence has shown on the 4H candles that DNT has already had a full series of Elliots and corrections, has had a 20 day double bottom, and is beginning to challenge resistance.
Keep your heads up. Do you really think DNT is only worth 9c?
In 30 days, you'll wish you had bought at 40 cents.
This entire move is the clearest bear flag ever if you zoom out or use 3D Heikin Ashi candles. It's all tight indecision candles on low volume. On top of that we likely finished an entire daily cycle that brought us nowhere: https://www.coinigy.com/s/i/5b1a649e56531/
Sorry to break it up to you but the biggest pump and dump of crypto history is now over... these 5 minute candles that show the picture of what happened... each candle is20% of volatility: https://www.coinigy.com/s/i/5a08000472a99/
If you're a longterm speculator, this could be a nice area to buy.
We have been in a sideways market all year between $200-300. If we stay above $300 we have effectively moved out of that cycle and begin something new. We were on target to remain in this cycle until the sharp rise the past few weeks which indicates a breakout.
To stay level-headed, I indicated the scenario of falling back into the cycle (red line). However, I also marked the upcoming halving. I don't see this scenario playing out. Buyers may want in before the halving with the hope of future returns. Old coins will more than likely continue to hodl, thus decreasing the supply, temporarily, while the demand accumulates.
The green line indicates more sideways movement in another area. The ~$300s will now be support, while ~$500 becomes the resistance; another barrier and key-area throughout btc's history. Again, with the upcoming halving and other pending good news, I see another scenario more likely...
Bitcoin remains on the rise, bouncing off the trend-line established by the previous sideways market... a launching pad if you will. ~3 months leading up to the halving we could see it's next bubble. During this a lot of old coins and longterm hodlers could dump and create a lot of volatility. In the aftermath, ~$500 could be the new support - if we can take away anything from past bubbles.
During the run up the past few weeks I sold @420 and bought back in @305. I plan to hodl until the next run up for the halving, then I'll reassess my exit for upcoming volatility.
TL;DR I'm bullish leading up to the halving. This could be a good area to get in on for longer-term hodlrs and traders.
The next areas of interest are $390-$475 on Bitfinex. I know that seems like a wide gap, but we've seen such a movement within a week in the past.
https://www.coinigy.com/s/i/563812b3/
Another point of interest and a past movement, also within a week, is $447 - $586. Assuming we even break $400. I'm still holding until I see any reversal patterns.
EDIT: On an aesthetic approach, we need to push more this week in order to sustain that beautiful curve. Beautiful.
You should look as them as averages, not support or resistance. The further you are extended from them, the more chance you get you will cycle back towards them.
what the hell kind of misleading graph is that?
https://www.coinigy.com/s/i/595b6ac573b8e/
The real thing. Pump. Dump. If you are holding any dgb you'll do your finances a favor to just dump on the next pump because there won't be too many more before it goes to 0.
I don't think it's going below 5700 right now, probably not even below 6k. But it's likely going to be a long equilibrium in this range for a couple of weeks. I wouldn't short here no, but I did short 6800 and I'm not closing it yet and I'll add around 6450 if we get there.
Daily stochastic still has some way to go too. https://www.coinigy.com/s/i/5b4680c0b58d5/
But I don't think this is the real bottom. And I sure as hell know this isn't the bottom if I look at Bitcoin from a macro economic perspective and I encourage people to look at it that way. Global markets and economies are slowing with EM, China and Europe leading the pack and the USA following late Q3 and Q4 in 2018. Why wouldn't Bitcoin suffer the same fate as other commodities/currencies/stocks? It's behaving exactly like them, topping around January and being in a downtrend ever since. A strong dollar = weak Bitcoin and the real dollar rally is only getting started. The joke is that there's plenty of stocks to find that have crashed harder than Bitcoin. People should start shorting financials (especially European) instead of Bitcoin, that's the moral thing to do :D
the chart also indicates a 2 month down trend line was broken on increasing volume. a positive sign for price movement :) im guessing other Techinical analysts will pick up on it too :)
https://www.coinigy.com/s/i/5997038d58806/
rising volume indicated in orange, and the breakout in blue.
look at this 12hour candlestick chart: https://www.coinigy.com/s/i/596d9ed7d3128/ in 6.5 hours we will have the 4th candlestick since the rebound come in completed, if that is green (currently red), it will be the FIRST TIME we have four green candlesticks since the bearish trend began, so, this might be a big indicator. it's usually just two green sticks and then red, so 4 green would be extraordinary and might be a signal of a reversing trend. that's all i got.
3-Day chart update: uptrend temporarily taking a breather with three 3D white soldiers below the resistance confluence of the 3D MA200 ($6550) and 3D MA50 ($6650). Critical time in the market now with meme triangles being bullishly invalidated on several exchanges and noteworthy closing of Bitfinex btcusdshorts (-44%) and ethusdshorts (-62%); a prelude to volatility.
Very different view if you use a line chart though. https://www.coinigy.com/s/i/5b292bfaeaec7/
Not implying that invalidates your argument but it's something I try to keep in mind. Every time we dropped down the weekly close was lower than the last time.
Well I'm not reddit and that run was because of fundamentals, there are no fundamental reasons for PRL to be dropping, it's just the market and pure technical stuff:
Made a quick chart: https://www.coinigy.com/s/i/5b1566f53cc3e/
(I meant 6250 or so instead of 6640, I made this pretty fast so it's a bit messy)
EOS/BTC short term trade potential: It has 6 inside hourly candles. This represents indecision, consolidation and contraction of price so that risk is easily defined.
Definitely put a stop loss as defined in the chart below as this isn't about being right but about having a few big winners and cutting losers immediately. That's how you make money in the long run. If BTC collapses (it looks like it will), you definitely want a stop loss in place.
If EOS is below 160k sats at the time of you reading this, this call is invalid.
https://www.coinigy.com/s/i/5b08e3b3181c5/
Update:
Shit broke to the upside, stops moved up to buy-in and then some. Time to sleep: https://www.coinigy.com/s/i/5b090b9ca7ee9/
bitfinex is one of the most popular, leading exchanges for the price of BTC, right?
it looks like the bear trend for BTC started cause it looks like bitfinex had a server outage temporarily (2 days ago) and when they came back online a ton of sell orders went through...
https://www.coinigy.com/s/i/59d5b1ad361c2/
what do you guys think?
Bittrex is flat 0.25% and their systems seem very reliable. Handled the insane volume amidst being the only exchange to reliably sell Day 1 Bitcoin Cash beautifully, whereas Kraken was down for literally 6 hours of the most important day of the year. They're US based and seem like they're above-average trustworthy for what crypto is.
They have no fiat (USDT is a scam in reality and a metric against fiat you can actually buy things with at best) so you'll have to convert to Bitcoin and transfer to an exchange that does.
For fiat extraction I'd probably recommend Gemini since they're US based.
Kraken has an awful UI and a lot of downtime. Better with their Cryptowatch platform but still not amazing.
I recommending Using Coinigy which is pretty much a crypto-version of TradingView and then choosing which/multiple exchanges to use. Here's a link for you: https://www.coinigy.com/?r=0f88d8eb.
Bitfinix is showing themselves to be a bit of a banana republic, and they don't have fiat withdraws.
Before you blockchain transfer someone anything resembling 3 Mega make sure they're legit and will process fiat to your bank with small(?) transactions.
I know people hate H&S patterns, but there's one that has formed on the ETHBTC ratio, and it looks like a lot of people are in short positions anticipating a crash. We're looking at 0.05 if does break through.
https://www.coinigy.com/s/i/59618fd562644/
Call me stupid, but I just opened a long here.
https://www.coinigy.com/s/i/562d8207/
Seems like we've been here before. Based on weekly, we could hit the $260s again or go up to $300-320 range this week.
Closed a long @ $294 today. Now waiting.
Edit: My speculation. Given the recent good news (china + eu) and a few projects coming to fruition (openbazaar + abra) I believe this pump will continue. Waiting confirmations to get back in. I'm hoping for $320 at the end of the week.
It either keeps it momentum and keeps blasting through (not really happening right now) or the price starts to roll over slowly at first but it will accelerate once we start losing uptrends (hourly, 4 hour, daily). Price went all the way from 6070 to 8500 without any meaningful consolidation like a 50% retrace of the prior move which is very common. So many of the longer stochastic cycles are very much extended by now and require a reset for another big rally. https://www.coinigy.com/s/i/5b587c6218bb3/ .The bands (EMA's) are also turning but from my experience they almost always fail to turn on the first attempt and price breaks down one more time so they can tighten/flatten followed by a breakout where they are aligned in the right direction, there's also the potential of tightening bands and rolling over.
There's plenty of overhead resistance and it's not going to break with a daily RSI that's overbought and everything so overextended. So far everyone still wants to buy the dip but it's likely going to be a brutal pullback if it starts going (bear markets often end with one more scare). Many ask at what price we could talk about a real reversal and for me the very first crucial thing that needs to happen is a retest of 6800 where we wick the support and swiftly bounce without all the ranging and shit we saw before. But ideally for now i'll buy into 7800 and the 7500 area.
This chart actually isnt unreasonable however I would be alot more confident if this chard was OMG/USD not OMG/BTC. Take a lot at similar ETH breakouts after long consolidations. https://www.coinigy.com/s/i/5af7845063215/ People always harp on about trading against BTC which is fine but its to wild for reliable TA in my opinion. USD charts are better for predicting breakouts imo. OMG/USD still looks good in my opinion however it looks like it could be a while till we break out of a penant which would actually line up well with the roadmap and fundimentals https://www.coinigy.com/s/i/5af785ddcbad6/
ARN/BTC getting quite tight. Airdrop is on May 7 for linker coin.. TA and FA are sound for uptrend to continue. I just entered with a tight stop. This should go up nicely soon.
In USD value, yes. But he isn't buying Stellar with USD, he's buying it with BTC, so that's the way it should be looked at so he can get it at the lowest price. If you look at the charts during 5-9 of December, you can see that XLM followed the movement of BTC. But if look at the 17th BTC entered a correction and began a downtrend, yet XLM has maintained somewhat of an uptrend / sideways movement, indicated by the purple line.
BTC: https://www.coinigy.com/s/i/5a41816a47c7d/ XLM: https://www.coinigy.com/s/i/5a4182a552d0c/
I haven't looked at the books, but there's a big support/resistance zone all the way through the 500s. I think it might fight around a bit in the 500s for a bit. This is also just a TA and considering how much this has been manipulated recently, I wouldn't rely on it much. Just figured I'd throw it out there.
I think it's a descending triangle pattern forming (which is agnostic for crypto... it could break up OR down). We have descending volume spikes, the MACD signal line is making it's way back to the 0 mark too. This looks like consolidation before a reasonably big move for this week in my opinion. https://www.coinigy.com/s/i/59971182be115/
I highly recommend Coinigy if you want charting features and the ability to trade on the charts. It supports trading and charting on multiple exchanges, but I mostly use Bittrex. There's a 30 day free trial and it's $10/mo after that, which is nothing if you are trading. You can use my referral link if you like it and I get $15:
https://www.coinigy.com/s/i/562e4a6f/
Still waiting to see what happens this week. BTC is in a cycle between ~$220-$320. We're approaching the resistance within the cycle. If this is truly more than a pump then we should be able to break through. Otherwise, we could see the trend repeat back to the ~$220 range.
I still don't know any other news outside of China & EU. Future pumps could come from projects, OpenBazaar and Abra. Also, the silkroad auction will be here Nov. 5.
Haven't heard much from the blocksize debates in a few weeks (the rise in price coincidentally). I know things remain unsolved but were working toward a solution. Perhaps the community sentiment is out of sight, out of mind... or... "they're going to fix it."
Any other "big picture" things happening in the coming weeks? My speculation is that a pump for the halvening won't happen until 3-4 months beforehand... putting Feb-Apr 2016 in that range.
Sure it isn't guaranteed but it's here or goblin town. It's a trade, I'm aware of the risks. I don't like to use channels as support, I use them as regression channels. If you break through it, you should cover/long it. Because the odds are bigger that it pops right back in.
It's right where I want it https://www.coinigy.com/s/i/5b6edd8e6a038/
Hi there! Matt from Coinigy here -- apologies for the vague reply from our support team. As far as guest mode goes, that just refers to a browser's guest profile where everything except for the base browser itself is disabled (Chrome's Incognito mode is another version of this). Generally speaking, we use that for troubleshooting as plugins/extensions/etc. commonly cause issues with the charting library, unfortunately.
That said, if you have already tried disabling them, it most likely has to do with your chart autosave file being corrupted or too big (meaning that the library is taking a long time to open the large autosave file). You can switch which autosave option you have enabled on your preferences page in your account here. Further, on the chart, you can delete any of your autosave files that may still be loaded with the middle of the three buttons in the top right corner (it is an image with a cloud and an outlined arrow pointing down).
Hope this helps! Please let me know if you continue to have any problems with it.
-Matt
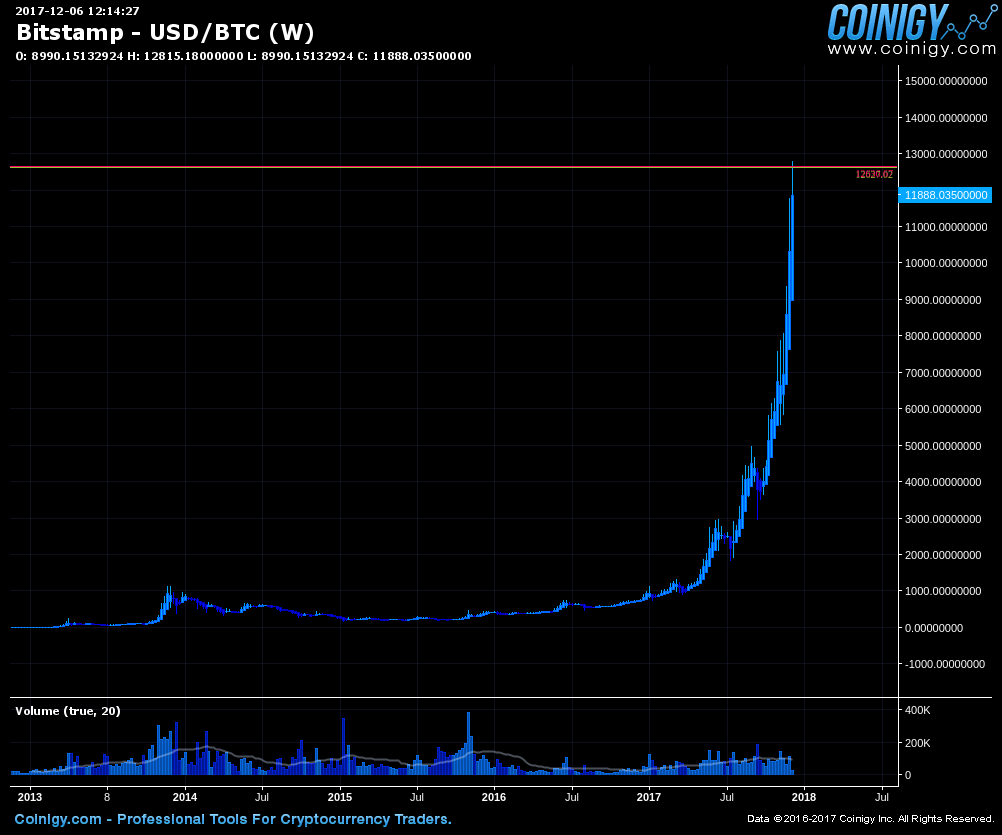
So how do you explain that on this day, 1460 days (4year) have passed since this https://www.coinigy.com/s/i/5b171391561f3/ in relation to where we are in the chart now?
I used coingy a while back and moved over to trading view but I think this may be worth trying out:
https://www.coinigy.com/bitcoin-exchanges/
It supports orders through kraken and uses the tradingview engine for charting. I actually may go back to it now that I think about it. Have to pay for it after a month.
https://www.coinigy.com/s/i/5b0726a4cd1cf/
using that on a tablet shouldn't be too bad.
ARN/BTC getting quite tight. Airdrop is on May 7 for linker coin.. TA and FA are sound for uptrend to continue. I just entered with a tight stop. This should go up nicely soon.
https://www.coinigy.com/s/i/5ad883a1c61cc/
Really? You think you can time these tops and catch these small dips? Very dangerous to day trade right now considering the upward trajectory. Now if it was more sideways I'd wish you best of luck, but this looks really bad to try to trade.
Most of the price manipulation and ridiculous candles are happening on Gdax. Bitstamp chart is much cleaner right now.
Anyway looks like someone badly wants BTC to form a head and shoulders and break this pretty weak diagonal support. It's still well within healthy correction territory. Let's wait and see.
Not fudding by anymeans. I'm here to make money, and mitigate my risk. So apologies for sharing. Don't want to sell? Don't. It's following the same exact pattern as before. Like literally almost the exact same pattern. https://www.coinigy.com/s/i/5a1136061b186/ Look at that! Hodling a few coins won't change that. I hope it does, but it's uncanny how similar the pattern is. That cannot be denied.
Bittrex is based in Las Vegas - but currently, the altcoin scene is unstable due to the anticipation of bitcoin hitting 6k. My account got halved in one night because people sold off their altcoins for whatever reason and I had most of my assets in altcoins. So let Bitcoin stabilize before jumping in.
OMG is currently a good buy - so you're getting it at a discount if you were to buy now. https://www.coinigy.com/s/i/59e7aad3df582/
Vertcoin is peaking- so buying in now would be like standing in line for the newest Iphone 8 - once you open that box, it's value depreciates instantly. https://www.coinigy.com/s/i/59e7aad3df582/
https://www.coinigy.com/s/i/599bd52738104/
It looks like we hit the very bottom of the fib lines. If we break below around the 280 sats level, then it may go even lower.
Or it could be that this is already the rock bottom, and it will only go up from here..
Take your pick
OP, I suggest you use Coinigy and link API keys to your accounts and not try to use website software in general
You can trade on Gemini, Bittrex, Bitfinex, Kraken. Really anywhere besides GDAX.
Think something is gonna happen here in the couple of hours days people, Head and shoulders kinda deal on the USD charts, A few resistance lines approaching on the BTC who knows Buckle up its gonna be a bumpy ride north or south!! https://www.coinigy.com/s/i/5998f521cdb4f/ https://www.coinigy.com/s/i/5998f5066377e/
> Coinigy 1000+ trading pairs on 45 exchanges, charting tools, active Slack etc, etc
Also going to post my response to a question about XRP in the correct daily thread....
I personally think XRP is trash. Having said that, there are plenty of ways to successfully trade it for profit. From the research I've done the XRP token doesn't have a real use. Ripple the company is doing a lot of good things but I haven't found a use case for XRP itself. Obviously this is one person's opinion, but I tend to agree with it: http://www.coindesk.com/ripples-xrp-giving-third-largest-cryptocurrency-second-look/
Check out my chart below, since the June 6th peak it hasn't been able to break through a downward trend. It's tried a few times unsuccessfully. I'd only buy it on confirmation that it breaks the trend upwards. If it gets close to that line again and fails to break through, you have a good short opportunity. Another way to play it is to buy around 6300 sats expecting a bounce. https://www.coinigy.com/s/i/596ba13119a4f/
A look at the bigger picture: https://www.coinigy.com/s/i/563d3954/
We very well could have failed to break out of this cycle. If so, in the coming weeks it could drop to $230 (assuming it resumes the sideways action). Or, we could still be in the beginning of the break out.
However, I still believe $250 to be the magnetic number that it keeps falling back to. I believe it to be a healthy number for Bitcoin in it's current state.
Looking at this chart the halvening will be interesting. That's 37 candles away. Here's a visual; I mirrored the last 37 weeks from where we are now - and a vague assumption that we stay in the cycle until then: http://i.imgur.com/fQJOhNW.jpg
The support line on the bottom actually collides in ~37 weeks. The next few months will be interesting nonetheless.
We need to look ahead at other possible scenarios: https://www.coinigy.com/s/i/563a96d8/
Before this breakout, we were stuck in a sideways market all year $200-300. I believe we'll have strong resistance going back below $300 (edit: support @$300 is what I meant).
I highlighted other key areas from the past as well.
You can look further down the thread for earlier thoughts of mine as well: https://www.reddit.com/r/BitcoinMarkets/comments/3rk2h5/daily_discussion_wednesday_november_04_2015_part_5/cwor7zt
>Zoom out.
https://www.coinigy.com/s/i/5620c1e8/
So yes?
It's interesting that these "altcoins" always base themselves off each other, and then ultimately USD.
But remember, USD is evil or something, and so are other bitcoins
I'm one of the devs from Coinigy.com. We will have an Android trading app with Coinbase integration within the next 1-2 weeks. It's just in final stages of testing and touch-ups. You can sign up for a 30-day free trial at Coinigy.com
Hey all, William from Coinigy.com here- Just thought I'd drop by on our "team account" and let everyone know our early adopter pre-sale is coming to a close, so this is your last chance to purchase an Annual or Lifetime Coinigy account (at a steep discount). All funds raised are going directly back into the platform towards development of new features and server upgrades.
If you're not familiar with Coinigy, we are a charting, trading and portfolio management platform that supports 15 cryptocurrency exchanges (and we are in the process of adding many more).
Security and stability are our main focus (http://coinigy.freshdesk.com/support/solutions/articles/1000087509-what-security-is-in-place-with-coinigy-)
Two Factor Authentication
Polling and Websockets API in development (fully featured!)
Real-time data & orderbooks across all exchanges through one common interface
60+ Technical indicators
Save and share chart screenshots and settings
Supported order types:
Limit
Stop Limit
Coming soon: Market, Stop Loss, Trailing Stops, Conditional Orders, Order Legs
Order execution email notifications and site notifications
Order history and tracking across all exchanges
Coming Soon: Cost basis accounting and open position tracking
Exchange account historical balance tracking and portfolio management
Wallet balance historical tracking and portfolio management for 110+ Altcoins
Daily balance e-mail updates
On-chart Orders, Alerts (Alarms)
On-site, E-mail & SMS price alerts
Live Chat
Beta sign up link: https://www.coinigy.com/auth/signup/?code=CCN125A
Happy to answer any questions in the comments. Thanks again, William
E-TRADE For Cryptocurrency.
Alpha testing stage, soon to enter Private Beta
We're mainly looking for a crypto-centric individual to plan and lead our future marketing efforts. Constructive criticism is also welcomed, some screenshots can be seen here.
Anyone who enrolls in the private beta will be given unlimited credits for testing, this includes anyone who signs up via r/startups.
Buenas,
Estoy con vos, me molesta que no haya una buena plataforma para hace trade. Ninguna de los que nombre es realmente bueno. No conozco LCG pero lod el trailing stop que comentas, muy util btw, no lo vi en ninguna.
Kraken tiene la "termina web" que es simplemente OK. Te marca los trades en el chart y gracias. Tiene unas alarmas medio berretines y es lento en comparacion a las alternativas.
Bitstamp es tradingview, low latency y rapido pero no me encanta personalmente
Binance y Coinex, son practicamente iguales. Tradingview y en el caso de binance tenes los charts de la plataforma tambien. A mi me andan mejor los charts de tradingview en este caso.
Habia una web interesante, no la probe personalmente pero tenia un companhero de laburo que la usaba para arbitrar. Coinigy, conectas tus exchanges via API y es bastante mas avanzado. Podes probarlos tienen un trial de 30 dias, despues hay fees y es pago.
The following comment by maliquecampbell was silently greylisted.
The original comment can be found(in censored form) at this link:
np.reddit.com/r/ BitcoinMarkets/comments/ddyd33/-/f2pnll7?context=4
The original comment's content was as follows:
> Glorious 12 hour swing, thanks to charts performing @ 3.0x speed > > Entry- 8.1 > > Stop- 8.213 (-1.40%) > Close- 7.888 (+2.62%) > > https://www.coinigy.com/s/i/5d99916f6e586/
Hi, Joe from Coinigy here -
So sorry to hear that you'd like to cancel your subscription with us. In order to do this, you may follow the link below to access the subscription cancellation page, then follow the prompts that follow by clicking the button at the end of the page, then confirm the cancellation and you should be good to go.
https://www.coinigy.com/subscription/cancel
Thanks for using Coingy, and we do hope to see you back with us soon.
Thanks for all the feedback!
1) Of course, that data is available for free, but the question is - do you want to spend your time to gather it? Also, please take a look at Coinigy offer, their prices are much bigger in this field! https://www.coinigy.com/bitcoin-data/
2) I could gather any coin/ticker, BTC/USD and ETH/USD are just examples! Thanks, that’s a great idea to list a few more pairs to make it more clear
3) Thanks for title catch up, fixed already
The following comment by maliquecampbell was silently greylisted.
The original comment can be found(in censored form) at this link:
np.reddit.com/r/ BitcoinMarkets/comments/ag4hpe/-/ee50y9i?context=4
The original comment's content was as follows:
> It's bear folk's, people have been selling off assets for over a year, causing discounts on many items. Ignore the opinions, separate the facts from the bulls*t. Just Accumulate https://www.coinigy.com/s/i/5c3e22e0c449f/
https://www.coinigy.com/s/i/5c2d9067ba012/
Let me know if you have questions.
Eli5 version. RSI, MFI, and mac d should mimic the price chart. When divergence forms on the chart on one of the indicators it is a sign of reversal from current price trend.
Stochastic RSI is sign of momentum looks to be building on the daily.
When all indicators are indicators align over 60 to 90 depending of strength of coin and run, it is a sign there are way more sellers than buyers and price will soon fall to find new buyers.
When all indicators align below 20 it is a sign of the opposite, there are more buyers than sellers and it is a good time to be buying with the rest of those greedy bastards.
Read up on definitions of money flow index and relative strength index if interested.
I do consider other factors .Sine cycle finished, daily stochastic low, found support at my knife catching EMA's, exhaustion dump after a prolonged dump,D BB destroyed. I'm not saying it's THE bottom, but the temporary bottom is getting very close.
https://www.coinigy.com/s/i/5b6e0fc35b8f9/
The following comment by Palmerstoned was silently removed.
The original comment can be found(in censored form) at this link:
np.reddit.com/r/ BitcoinMarkets/comments/958chw/-/e3solp8?context=4
The original comment's content was as follows:
> This aged well. Now onto the second part please
> https://www.coinigy.com/s/i/5b58aa6661008/
The following comment by Palmerstoned was silently removed.
The original comment can be found(in censored form) at this link:
np.reddit.com/r/ BitcoinMarkets/comments/91oiyh/-/e313wo3?context=4
The original comment's content was as follows:
> Hope you all filled your bags of XLM because the rocket ship is launching!
>
> Very close to a breakout from this triangle formation.
>
> https://www.coinigy.com/s/i/5b58e2e6941e4/
>
>
> Sorry, no alt discussion so I had to put it here.
There's so much volume on BTC anyway that posting this here won't change anything, so here you go: https://www.coinigy.com/s/i/5b4495bd48f8d/
In a nutshell, buy gradually below previous important support (line), sell around there when it bounces back up (circle). Volatility has been crap these last few weeks, but you can still make it work if you use conservative sell areas (selling gradually at 5%, 8%, 10%+ profit, for instance, then liquidating the rest as it nears your break-even point on the way back down). Use this method mostly on large volume coins (BTC, ETH, LTC, NEO, etc.) and you should be golden.
There have been so many instances lately where a whale could pump through resistance and change the market structure but it just never happens. 7.8k and 6.8k where critical points and it was so close to being broken. If this was manipulated, it would have been easy to pump through it and change the trend or at least the structure of this downtrend.
https://www.coinigy.com/s/i/5b2f71ffa0bdb/
But you are right, this level could be a spot for a reversal.
So ETH is smack in the middle of the equilibrium pattern that's been forming for a long time. https://www.coinigy.com/s/i/5b16334aad3e9/
This is where the flippening will be decided. If the market decides to take a major dump, which is all too likely when I look at longer term timeframes, the ETH ratio is probably going to go down hard (USD value too). The fact that the weekly cycle is about to cross down is also bearish for ETH. Bitcoin already went through bear markets. ETH has not. It might sound crazy but you might see ETH trading at 50 again. It's only 14 months ago that it was at 50 and there's no fundamental reason or technical reason to assume it can't drop down to retest those levels. Bitcoin is probably going to do the same too.
I won't be surprised at all if you see some FUD coming the next days about ETH being a security but it's not really a requirement for the market to dump, it's going to happen anyway.
yo guys i found a potentially good trade
ARN/BTC on binance has 5 hourly inside bars.
Enter, set stop to below previous low wick. 0.50% risk, lots of upside potential.
If there are no more hourly inside bars (on the live chart) by the time you read this and it has broken up or down, this call is invalid.
This token is floating signal with nothing positive to send it up or really negative to bring it down. It oscillates between $20 and $7 on a monthly basis.
If nothing substantial is released in the next few months, expect it to do what it's always done. After the disappointment at EDCON, the new delayed roadmap, the sentiment is not positive and we're on our way to $7.
Hopefully, we can break out of this channel by the end of year, where we at least hold $20.
If you don't believe it, look at this pretty sine wave and tell me I'm wrong:
ARN/BTC getting quite tight. Airdrop is on May 7 for linker coin.. TA and FA are sound for uptrend to continue. I just entered with a tight stop. This should go up nicely soon.
True, it did fell out of the bottom of the triangle but in doing so, it confirmed a new bottom on the marked formation. Try to be calm brah, do some research on bear traps. If you absolutely can't manage and you hands start to shake, the option to sell always remains (since my order is still open :p). Go ahead check it out: https://www.coinigy.com/s/i/5adb755e23518/
The following comment by bordana was silently greylisted(for 13.4 hours).
(It was mod approved at: 2018-04-14T09:10:38.000Z UTC)
The original comment can be found at this link:
np.reddit.com/r/ BitcoinMarkets/comments/8c1qmg/-/dxbftae?context=4
The original comment's content was as follows:
> That doesn't seem right. You should be able to start a free trial on the main page here: https://www.coinigy.com/ > > Or on the top right click on 'sign-up'. > > I just now started a free trial form the main page.
That doesn't seem right. You should be able to start a free trial on the main page here: https://www.coinigy.com/
Or on the top right click on 'sign-up'.
I just now started a free trial form the main page.
Coinigy with stop limit orders. They won't result in each limit order amount to be committed to the books, allowing you to place an upper SL but and low SL Sell whereas bittrex will not let you place the second one due to insufficient funds. Space out the stop from limit order to give time for your limit order to execute before market price moves past it. For the sell place limit sell price super low, super high for the buy... You can use the 30 days free trial :
I agree. I am also thinking in that same ballpark as Kisamalot (180-225 sat). Here is an image of my prediction. Let me know if you guys have any different perspective on this.
Just so you know, I think you've still got the wrong screenshot on this post. It should be this surely? You've accidentally got this.
u dont have to be perfect. Just compare the average dip/bounce and set your orders a little less to be safe. (some of my buy/sells are not shown due to coinigy errors thru phone app) https://www.coinigy.com/s/i/5a3d4eaecb847/
By the way. You can use coinigy for technical analysis of quantstamp. They use the trading view interface. Its a subscription based service, but you can test it 14 days for free.
Link for your info:
https://www.independentreserve.com/ 0.05% fees. XBT,ETH,BCH for AUD. Good security. You have the choice of buying at market price, setting buy limits, sell limits.
Once you've bought into a currency you can set up an Exodus (or Eden for more experienced users) wallet and exhange through their platform (they use shapeshift, super easy but transfer rates aren't the best) Or you can set up a Bittrex account, as mentioned by sbnas and trade through their platform. Very low fees, great altcoin trading in real time at market price. All altcoins use USDT coin, a tether to the USD. Tether claim to have a 1 USDT - 1 USD currency value and in the last 6 months they have been fairly spot on. Have a look into https://www.coinigy.com/ too, there you can view almost, if not, all trading platforms and intergrate their software with Bittrex through their API settings.
I also use Binance which is a great "altcoin only" cryptomarket.
Here is the post for archival purposes:
Author: emrebil88
Content:
<ul> <li>Disclaimer (lots of high level math) Hours of research on Elliott Wave Theory, Relative Strength Index, Fibonacci, and Bayesian Probability. Let me know your thoughts.
Coinigy interface allows you to do this with Bittrex exchange. Your coins don't get tied up when using "Stop (Limit)" orders so you can set stop losses below current prices and above. Note it is a paid service and this is a referral link but I truly think the service is worth it. https://www.coinigy.com/?r=e94c1d79
My friend, this is the profile of a price curve that is very close to its breaking point. Winter is coming and most people here don't see it. At 1800$ I'd have told you to go for it, but not now. For long term investment, it's the worst time to buy.
https://www.tradingview.com/chart/wDJxgE5i/ - for charts and technical tools
https://www.coinigy.com/ - for crypto specific version
altpocket.io - great for seeing whole portfolio at a glance as well as averaged porifts which is awesome
Here is the post for archival purposes:
Author: Rickest_Rick_Ever
Content:
> https://www.coinigy.com/s/i/5a11317581d9f/
>@philakone... called it.
>$1,000,000 sell order at 1175... bye bye price.
>This is not a fud post, get out. See you back at ~900
Here is the post for archival purposes:
Author: Rickest_Rick_Ever
Content:
> https://www.coinigy.com/s/i/5a11030117776/
>All constructive thoughts welcome. What do you guys think? Seems like it's following the same path..
The order book had nothing left open on the sell side, but whales still had coins not on orders.
1 - Shut down website trading, leave API servers open for trading
2 - Whales login through API app and market liquidate their BCH for BTC. https://www.coinigy.com/
3 - BTC maximalists make a huge profit from selling BCH high and crashing the market. BTC always goes flying up when exchange servers crash, so they double win.
UPDATE
https://www.coinigy.com/s/i/59fd0b721f1cb/
https://www.coinigy.com/assets/img/charts/59fd0b721f1cb.png
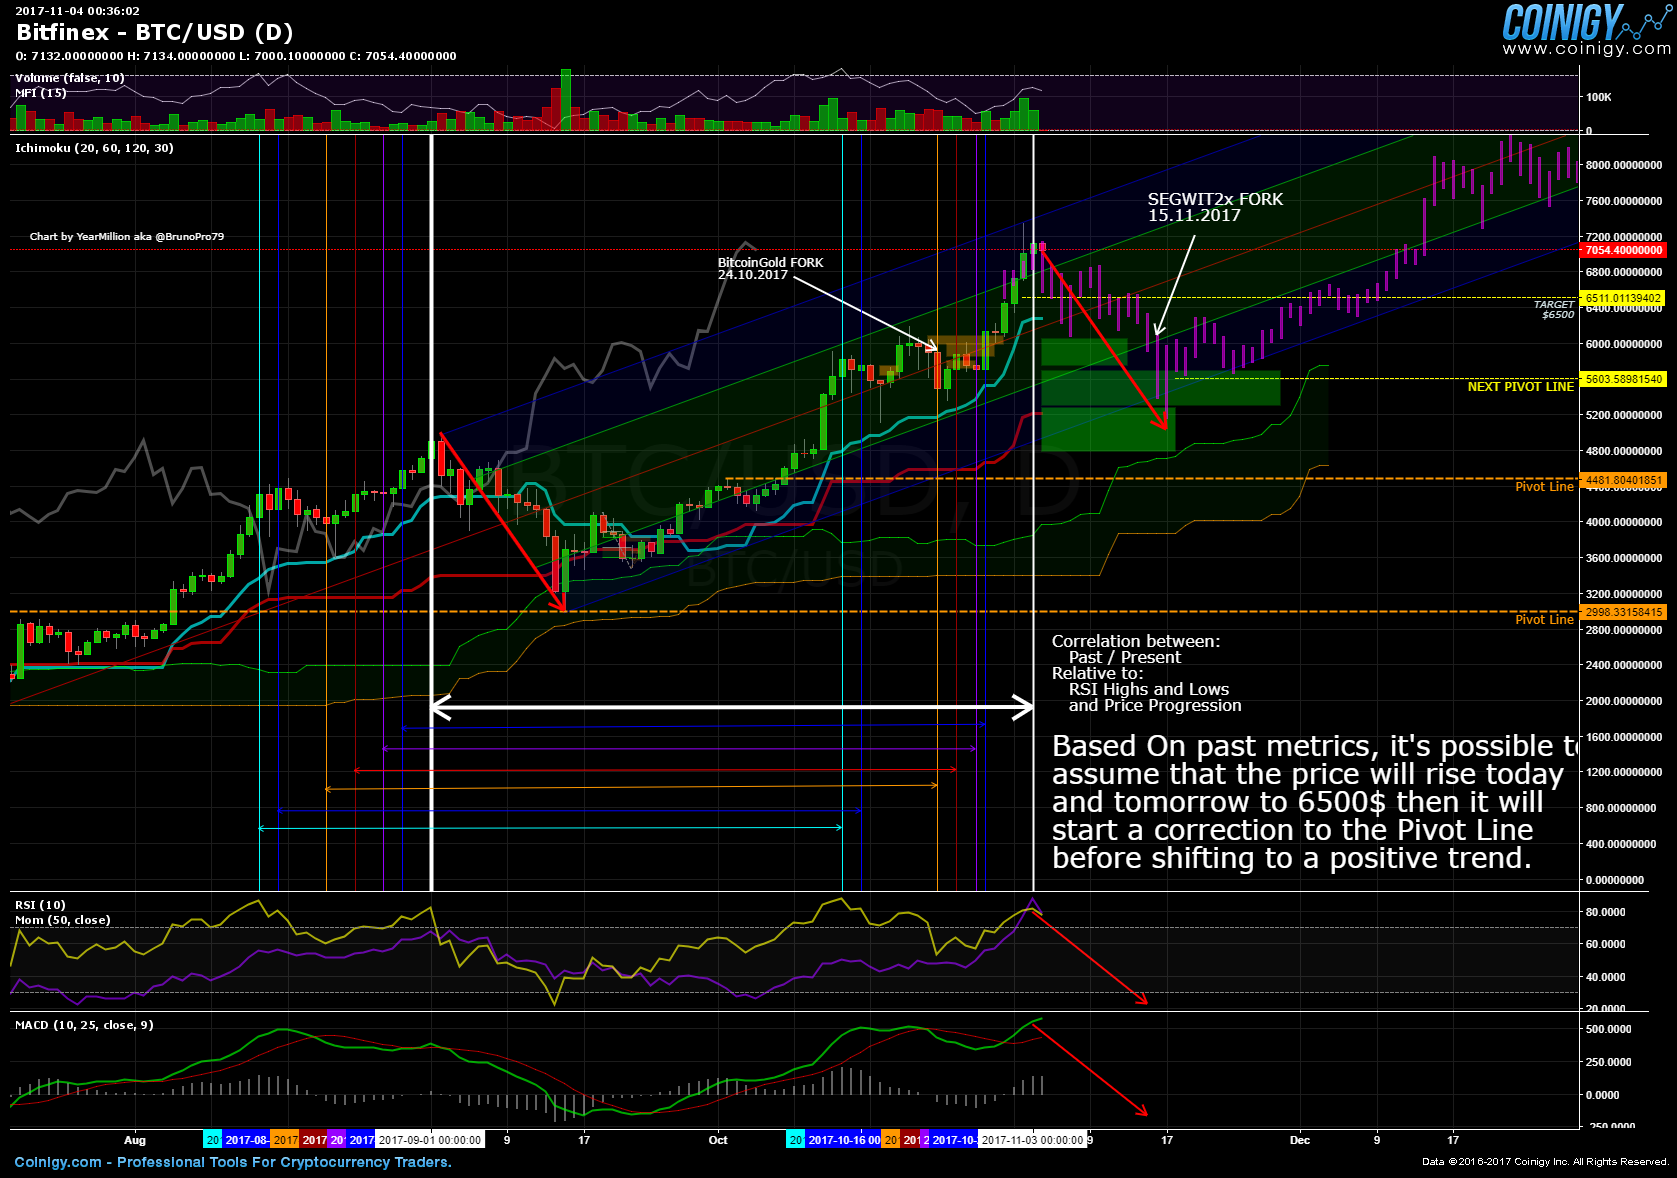
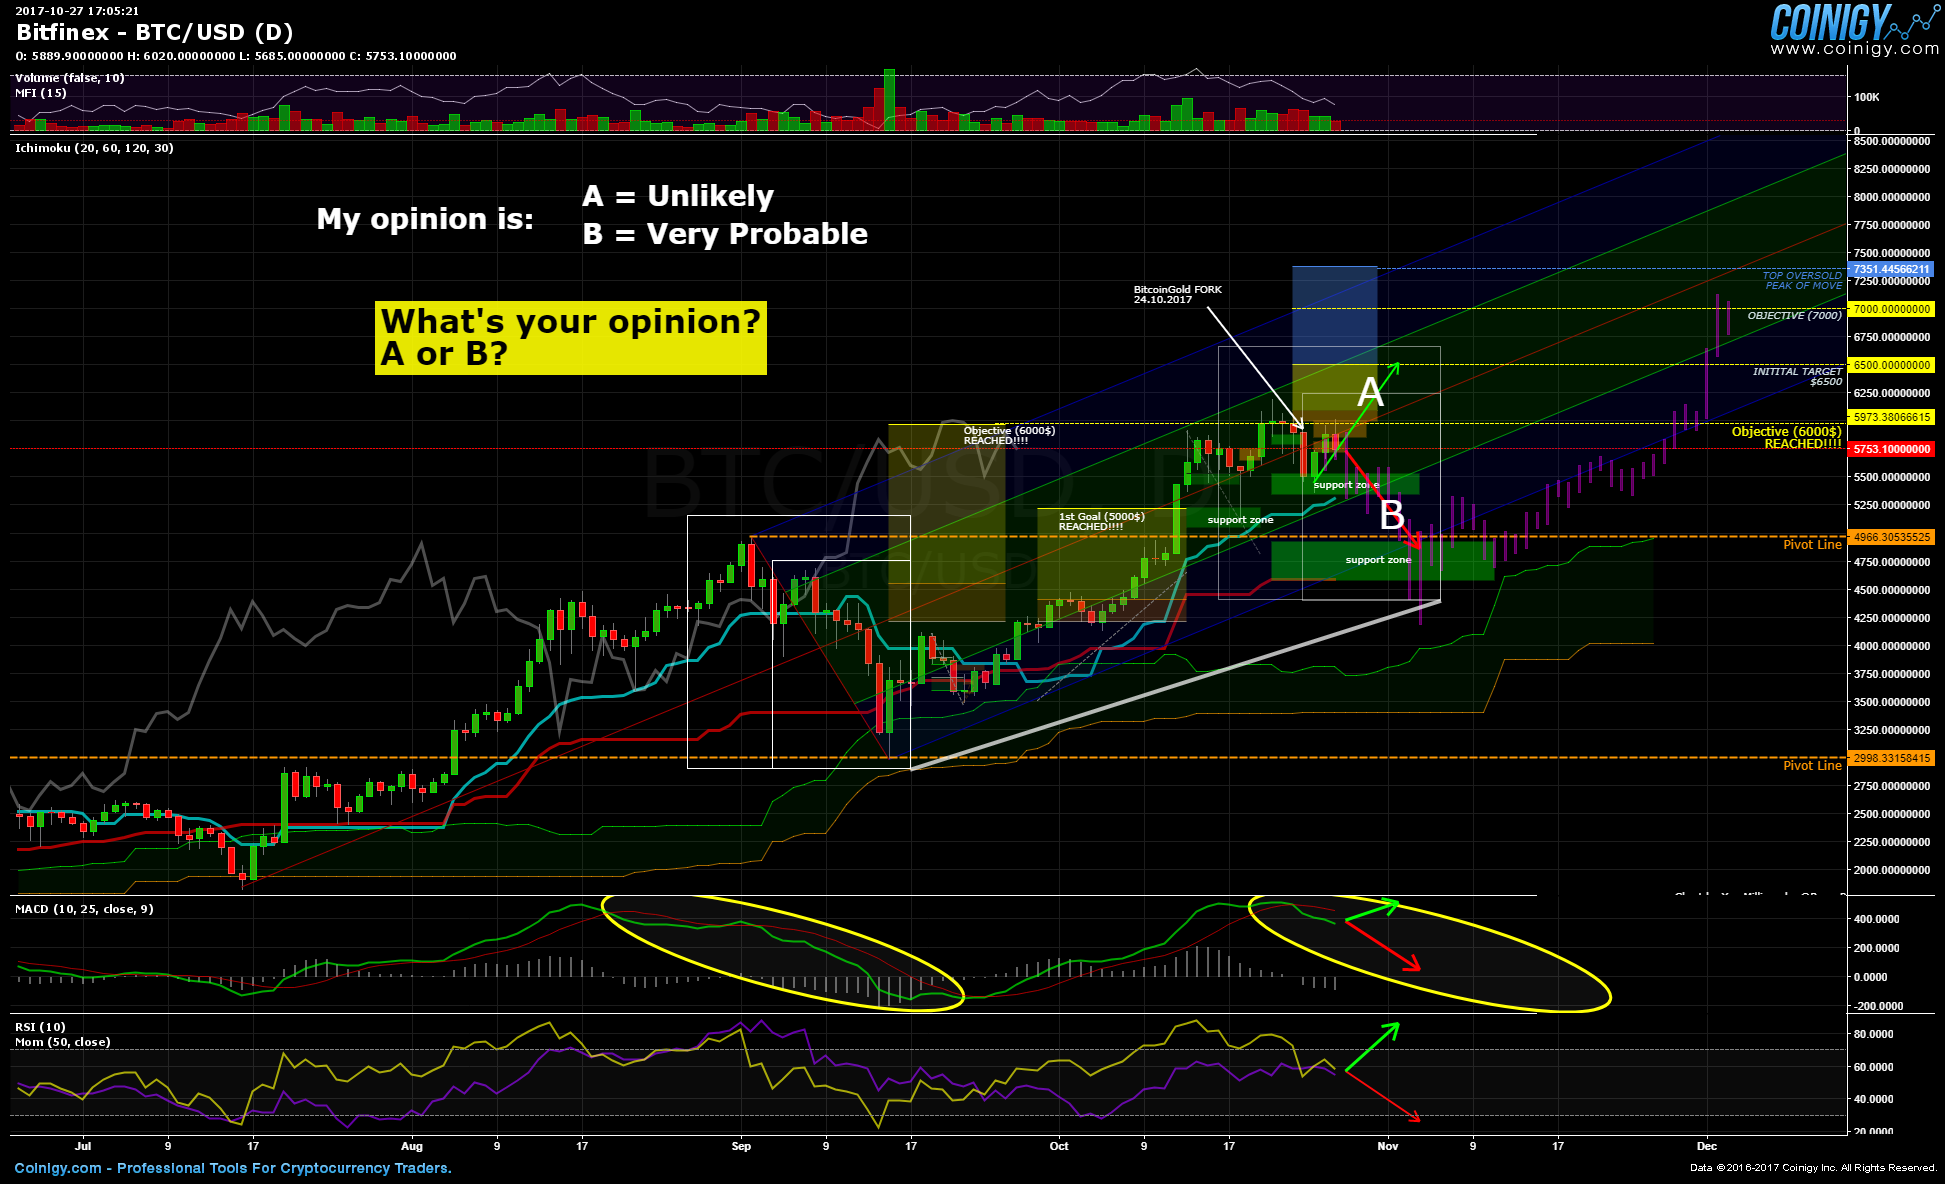
I didn't expect such a strong final push, the logical price to the top would be around 6500$, but it went to 7500$... Now the RSI has reached that TOP I was waiting for... now looks like the timing is right...
So guess my 90% prediction isn't that far off looking at today's charts right? ... Today or tomorrow we will see a considerable price fall.
Chart update here: https://twitter.com/BrunoPro79/status/923960052821700608 Img: https://www.coinigy.com/assets/img/charts/59f36751c3576.png
That's exaclty the attitude that made you fuck up the first TA.
Just because UBIQ is going up a tiny amount doesn't mean investing then would've been a safe choice like you made it out to be and it still isn't in the clear yet.
I wouldn't have invesated at that point because I trade breakouts not falling knives.
Your "Go in or go home" is still idiotic to me and your TA based on USD while UBIQ isn't even paired with USD is still stupid.
https://www.coinigy.com/s/i/59e9de34eed81/
All those 3 would've been your floor and all of them popped and still where a really bad investment.
Assuming you closed the other day at ATH, that would have been 30%, but seeing as you just sold that's only 20% (https://www.coinigy.com/s/i/59e7ffac86e93/).... but congrats you waited a few months to buy in and hold for 4 days and it wasn't even a good trade, almost all alts went up while btc went down.(https://www.coinigy.com/s/i/59e804713a9d3/)
I don't comment on coins I don't know or haven't researched. Stratis is a shit coin, I can confidentially say that.
I LOVE THIS DAY:
so many things are rekt
No one gives a fuck about SIACOIN anymore,hahahah https://www.coinigy.com/s/i/59daa2fb11baf/
Here's the updated 4H chart with that beautiful green bar that I was expecting and announcing... https://www.coinigy.com/s/i/59d809de9df04/
Prediction with 100% accuracy tweeted hours before push ;)
I've only really used GDAX and Kraken.
Kraken is ok but their charting is horrible.
Some of my trading uses their APIs. That's one of the things I really like about CoinBase. I am planning on checking out Gemini and Bittrex soon. I've also messed with Coinigy but I didn't love it and I think there are delays on their data feeds. They do work with a lot of exchanges though: https://www.coinigy.com/bitcoin-exchanges/
> Coinigy 1000+ trading pairs on 45 exchanges, charting tools, active Slack etc, etc
Correct - you have limit orders where you just set a price and say buy all NEO at $10 or you can set a conditional that says buy NEO at or below $10, so if someone unloads a bunch of neo for 8 dollars - it would buy it for whatever the price the person set instead of agreeing to pay 10 dollars no matter what. It is a bit confusing but the same concept when creating sell orders with stop loss.
Neo is trading at $10 dollars - and you just bought a boat load. but now, you see it drop to 9.50, then 9.00 then it shoots back up to 11. So you feel better, but not exactly comfortable. you can set a sell order on bittrex for autosell at or below 9.00 to save your precious funds. the reason you do this instead of a limit sell is if you are willing to sell at 10 and the next guys wants to sell at 9.50 - all sell orders will go to him first. this basically lets you exit the trade asap while accepting any price below 9.00.
All of this can be done on Bittrex. it is a really good exchange mechanically. If you want to get more out of your crypto-trading experience - I cannot recommend Coinigy enough. (disclaimer: is my personal referral link) it has hundreds of tools, scanners, is connected to dozens of major exchanges and can execute trades directly from one place. I use to just use bittrex and tried using their shitty reports but it was extremely un-intuitive. the candle scaling is weird etc. I have to say, take a run at the free trial - it last 30 days and i dont think it requires a card. check it out, if you are disappointed, I will give you a 100% NO-money back guarantee!
I personally think XRP is trash. Having said that, there are plenty of ways to successfully trade it for profit. From the research I've done the XRP token doesn't have a real use. Ripple the company is doing a lot of good things but I haven't found a use case for XRP itself. Obviously this is one person's opinion, but I tend to agree with it: http://www.coindesk.com/ripples-xrp-giving-third-largest-cryptocurrency-second-look/
Check out my chart below, since the June 6th peak it hasn't been able to break through a downward trend. It's tried a few times unsuccessfully. I'd only buy it on confirmation that it breaks the trend upwards. If it gets close to that line again and fails to break through, you have a good short opportunity. Another way to play it is to buy around 6300 sats expecting a bounce.
For those interested, you can see our full exchange support here: https://www.coinigy.com/bitcoin-exchanges
We offer full portfolio management and order tracking for several exchanges, not just Bittrex and Poloniex. :)
Coinigy is the most advanced I've used so far. A subscription is needed, but it's worth it IMO. There's a free trial of 1 month, so that may help you evaluate the platform.
I should've mentioned that if you want to get in on this at a more reasonable level, check out this 4H chart. I'm not saying that this is necessarily the top, sometimes you just have to keep redrawing your fibs and looking for obvious structure support.
https://www.coinigy.com/s/i/57aec8f3/
Good luck!
Rule #something: No referral links in submissions
-
> Coinigy isn't an exchange but a brilliant charting platform that you can place trades through by inputting your API from whichever exchanges you're signed up on.
First time I've traded anything was cryptocurrencies here is the capetown exchange: https://www.bitx.co/market you can also try https://www.coinigy.com/ that links into the international exchanges with lower (or no) fees.
This suits my needs for hedging against rand devaluation and gives me a bit of day trading trill as well :)
Sure: https://www.coinigy.com/s/i/563beb0f/
EDIT: "plastering this thread" seems a little harsh given my comment history. I usually post my thoughts with a chart to back it up. Today this was my first post (outside of a BFX question).