
What are
/r/TropicalWeather's
favorite Products & Services?
From 3.5 billion Reddit comments
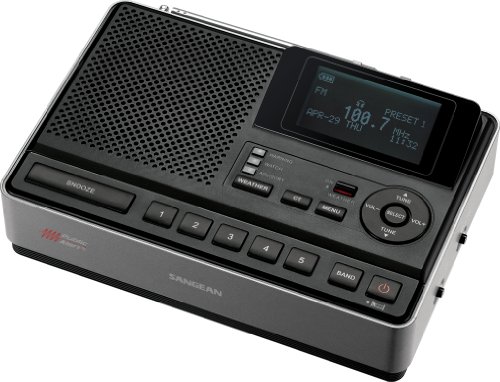
The most popular Products mentioned in /r/TropicalWeather:


The most popular Services mentioned in /r/TropicalWeather:
Weather Underground
The Weather Channel
CodePen
Windy
AccuWeather
Airbnb
WeatherBug
iHeartRadio
Streema
Dark Sky
KAYAK
Audible
TinyURL
Snipboard
Disqus
The most popular Android Apps mentioned in /r/TropicalWeather:

wX

Windy: wind, waves and hurricanes forecast

NextRadio Free Live FM Radio

NOAA Weather Radar & Alerts
PressureNet

Ustream
Rainy Days

HERE WeGo - Offline Maps & GPS

Cell 411

Discord - Chat for Gamers

NOAA Weather Unofficial (Pro)
Blitzortung Lightning Monitor

Dark Sky - Hyperlocal Weather

MyRadar Weather Radar

Waze - GPS, Maps, Traffic Alerts & Live Navigation
The most popular reviews in /r/TropicalWeather:
Probably to scare people, they are a media company after all.
Edit: I'm not a big fan of TWC because of this, they're like Accuweather to me basically. I recommend looking elsewhere for media coverage. On mobile instead of their app, I recommend a mix of the following:
- nhc.noaa.gov and your local noaa.gov site can be added as shortcuts on android and ios.
- Wx & All Clear are pretty good as well
- RadarScope is pricey but the best radar app IMO.
Not much of a TV replacement, although news stations will cover hurricanes quite a bit as well.
Also funny enough firefox is telling me Accuweather is spelled wrong. When I right click on it it suggests "weathercock" as a replacement. Sounds about right lol, they are a bunch of cocks.
I bought a solar-rechargeable battery bank on Amazon for this one. Figure I can at least charge up my phone/Kindle and power a small USB desk fan for the hot night.
EDIT: I got this one. Reviews were good and it has an integrated flashlight.
This is part of the reason why I am not a fan of the current classification of these storms.
If you check here: https://weather.com/storms/hurricane-central/AL062018
It is a CAT2 because the sustained wind speed is 110 mph. One more mph it is a CAT 3 and officially becomes a "Major" storm.
Will a jump of 1 mph make a difference? No, but the media and people here will run with it...
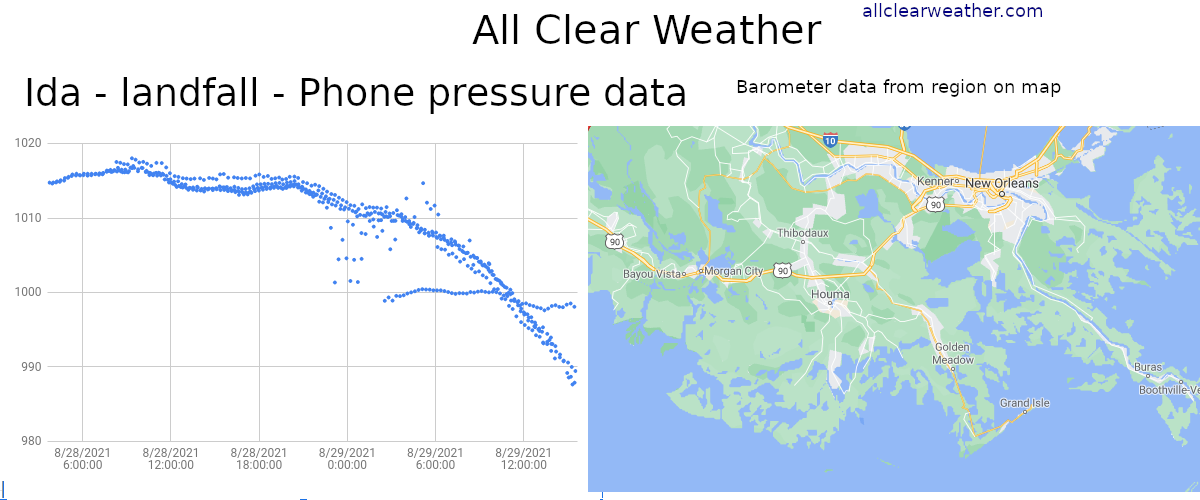
Last 36h of surface pressures from phones with barometers in SE LA.
Data from you wonderful people contributing by downloading All Clear and turning on Sensors: https://play.google.com/store/apps/details?id=com.allclearweather.android
Data is raw, not MSLP pressure, most phones have a barometer, happy to answer questions.
I need to grid out the data and make it easier to see which sensor is in which part of the map, and to color the data better. I'll post a bit less in the coming hours with a hope to make you a better visualization.
This is just so wild. Please stay safe. Thank you for contributing!
Surface pressure measurements from across Louisiana last 6 hours:
Data collected from you all! You ROCK! Data is from barometers in Android phones: If you want to join please get it on Android here
https://play.google.com/store/apps/details?id=com.allclearweather.android
Your location stays private which is why the graph linked has no user-specific locations. For future graphs I will grid anonymized measurements so the data is more localized.
More charts coming. Hopefully I can up my graphics and visualization skills.
PLEASE BE SAFE. Recording data is for hobby and maybe future science, your life is way more important, please stay safe :)
It's me again. I want to track the center of Laura over land using barometers in Android phones. If you are anywhere near the cone (like half the US! WTF) then please consider using your Android phone to watch the pressure drop and contribute the data for science!
The app: https://play.google.com/store/apps/details?id=com.allclearweather.android
My pitch usually includes links to papers and graphs and charts I made in the past. But not this time. No time right now. I will DEFINITELY be making visuals from this storm using phone barometers and hopefully the data will be scientifically useful too.
Stay safe!
No. Last year there were eight named storms simultaneously in just the northern Pacific Ocean. Seven across both northern oceans is above average, but far from "extreme" for the peak of hurricane season.
As my power has already gone out from a small feeder band (back on now), probably helpful to know that some phones (Most Samsung Galaxy devices) have an FM radio built in. You can use the Nextradio app to listen to local stations over the FM chip. It does require headphones to act like the antenna.
Dr Jeff Masters disagrees.
>Sea surface temperatures (SSTs) are near 29°C (84°F) across the eastern Gulf, which is 1 - 2°C (2 - 4°F) above average for this time of year. Even though it is early October, no cold fronts have yet chilled the waters near the central Gulf Coast, so very warm surface waters are in place to support Michael right up to landfall.
https://www.wunderground.com/cat6/Category-3-Michael-Intensifying-En-Route-Florida-Panhandle
<strong>WUNDERGROUND Personal Weather station KLAGOLDE1 at Port Fourchon.</strong>
Air pressure rises to 939 millibars.
- 11:25 A.M. Eastern - 976 millibars
- 11:40 A.M. Eastern - 971 millibars
- 11:55 A.M. Eastern - 964 millibars
- 12:10 P.M. Eastern - 957 millibars
- 12:25 P.M. Eastern - 949 millibars
- 12:40 P.M. Eastern - 941 millibars
- 12:55 P.M. Eastern - 937 millibars
- 1:10 P.M. Eastern - 936 millibars
- 1:25 P.M. Eastern - 939 millibars
Lowest at 27.65 mm/hG
Last time I update this station. The pressure will really only go uphill from here on out.
<strong>WUNDERGROUND Personal Weather station KLAGOLDE1 at Port Fourchon.</strong>
Air pressure drops to 949 millibars.
- 11:25 A.M. Eastern - 976 millibars
- 11:40 A.M. Eastern - 971 millibars
- 11:55 A.M. Eastern - 964 millibars
- 12:10 P.M. Eastern - 957 millibars
- 12:25 P.M. Eastern - 949 millibars
Holy crap, sub-950 is reached and the storm's barely made landfall.
Possibility of a 4th still...would be the first time since 1998.
"As it turned out, four simultaneous Atlantic hurricanes had not previously been observed in the satellite era; or since the 1960s.
Going back further into the so-called best-track database, there had been no record of four simultaneous Atlantic hurricanes since 1893."
In Miami here, actually southwest Miami in Kendall, here is my weather station if you guys want to check the rain and wind speeds. https://www.wunderground.com/personal-weather-station/dashboard?ID=KFLMIAMI322#history
Not sure why you're getting downvoted. Dr. Jeff Masters over on Weather Underground hasn't, given current models, ruled out a low-end Cat 4.
All ya'll Android users running All Clear Weather to report in your surface barometric pressure rock!!
We're going to get the most incredible pressure graph and charting data out of this, I promise to make as much data available (while protecting location privacy) during/after the storm with lots of graphs and maps.
Cheers and stay safe everyone!
Katrina was already a Hurricane when it entered the gulf, that’s the big difference.
It looks like some private weather stations that are listed on weather undergound have been able to stay functioning to at least some degree, and it's been interesting checking some of them out. This one from Bourg, LA, is really great. https://www.wunderground.com/dashboard/pws/KLABOURG19
I know PWS aren't the most accurate, but even still it's really interesting to see the immense pressure drop and the related precipitation and wind.
It's exactly that, a subtropical storm with hurricane-force winds. The terms tropical and subtropical when it comes to hurricanes doesn't signify if it's coming from the tropics or subtropics. They are classifications of types of storm organization (see here).
<strong>WUNDERGROUND Personal Weather station KLAGOLDE1 at Port Fourchon.</strong> While it doesn't give wind speeds, it is giving the air pressure level, which over there is currently at 976 millibars (at the edge of the eye).
It also updates very often, which is nice. It will be interesting to see how low air pressure goes here.
Bermuda Weather Services observations have been offline since approx 2AM. There is a personal weather station in Somerset (Western part of the island) still showing sustained over 90MPH and gusts over 100MPH. The storm must be ~50Miles north of us, but it's clearly strengthening as these are the strongest winds at our house since this thing started.
I've got 4 now:
- Emerald Island
- Frying Pan Shoals
- Ocracoke Island
- Atlantic Beach
Edit: I've got 9 relatively reliable cams, I'm gonna keep it where it is for now.
- Emerald Isle
- Frying Pan Shoals
- Ocracoke Island
- Ocracoke Island
- North Topsail Beach
- Atlantic Beach
- Kill Devil Hills
- Myrtle Beach
- Myrtle Beach
Enjoy!!
https://codepen.io/alexneises/full/qMKROv/
>A portion of Florence’s remains could develop next week
>The remnants of Florence moved off the Northeast U.S. coast on Tuesday as an elongated zone of low pressure. As least two low pressure systems are expected to develop from Florence’s remnants, with one portion potentially transitioning to a tropical or subtropical storm by the middle of next week.
reposting:
As my power has already gone out from a small feeder band (back on now), probably helpful to know that some phones (Most Samsung Galaxy devices) have an FM radio built in. You can use the Nextradio app to listen to local stations over the FM chip. It does require headphones to act like the antenna.
I really wonder how strong Haiyan really was. The satellite presentation was absolutely unbelievable. http://cimss.ssec.wisc.edu/goes/blog/wp-content/uploads/2013/11/131107_coms1_ir_haiyan_anim.gif Estimates put Haiyan at ~860mb pressure. https://www.wunderground.com/cat6/possible-new-world-record-lowest-barometric-pressure-860-mb
The first major rainband is hitting Apalachicola right now. Winds are gusting over 40 mph on the bridge to St. George Island. Storm surge is already ~2 feet above normal and rising. High tide is expected in 3 hours but the water will likely continue to rise through the day.
Not sure if this is the place for it but Cincinnati, Oh is pulling for you. Here's how others around the country can help.
https://weather.com/storms/hurricane/news/how-you-can-help-hurricane-harvey-victims
<strong>WUNDERGROUND Personal Weather station KLAGOLDE1 at Port Fourchon.</strong>
Air pressure drops to 941 millibars.
- 11:25 A.M. Eastern - 976 millibars
- 11:40 A.M. Eastern - 971 millibars
- 11:55 A.M. Eastern - 964 millibars
- 12:10 P.M. Eastern - 957 millibars
- 12:25 P.M. Eastern - 949 millibars
- 12:40 P.M. Eastern - 941 millibars
How low can it go?
A couple points.
“The flooding was underwhelming” what a perspective to have that flooding of any kind can be underwhelming. Sorry it wasn’t severe enough for you.
https://weather.com/news/news/2019-07-14-tropical-storm-barry-impacts-louisiana-mississippi This covers the impacts of Barry and shows Mandeville still underwater, so it wasn’t old footage.
You mention the flooding wasn’t “out of the ordinary”. What does that mean? It isn’t normal for water to be submerging cars and homes.
“Unforecasted storm” I can most certainly tell you that the storms from the middle of last week was not “unforecasted for.” The NWS is on top of systems that have the potential to flood places. Much like Barry.
I’m so confused how we’re getting the idea this was “overhyped” when we got what was forecasted for. A strong tropical storm/weak hurricane that was going to be a rain producer and coastal flooder. The forecast mostly verified, outside of path and perhaps wind intensity.
I’ve been reading an amazing book about Polynesian settlement. You should check it out. It’s fascinating and a really good read. The problem is it’s led to a google earth and Wikipedia binge where I’ve learned about islands formed by a god doing goatse to captain cook to the physics of sailing and now I’m ready to leave my family and buy a sailboat.
> home which is situated in a very low lying area near the Cape Fear River.
Current projections for storm surge in the Cape Fear River are 6-12 feet
And that's just the surge. The storm looks like it will sit on Wilmington for the better part of two days, dumping 2-4 feet of rain on the area along with two days of hurricane winds.
If that doesn't convince them I'm not sure what will
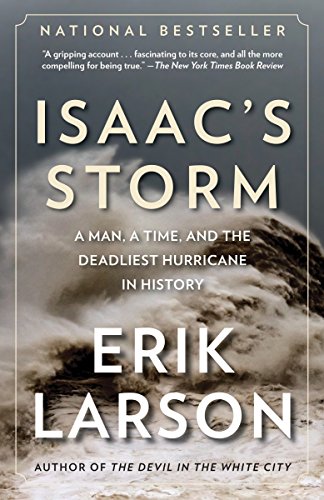
He was a pioneer in establishing what we know now as the NWS so you aren’t far off. One of the best books I’ve ever read is called <em>Isaac’s Storm: A Man, a Time, and the Deadliest Hurricane in History</em> by Erik Larson(Devil in the White City) that reads like a firsthand account recreated with what’s known from the actual history.
It’s a relatively quick read and it really dives into interesting things like how poor communication(among other socio-political issues) between the US and Cuba prevented the news of the 1900 storm getting out in enough time to do much about it. The book was gifted to me when I lived in Houston, and interestingly enough also explains how Houston became the dominant port city as a latent effect of the 1900 storm’s effect on Galveston and any future it may have had as the big-dog port city.
<strong>WUNDERGROUND Personal Weather station KLAGOLDE1 at Port Fourchon.</strong>
Air pressure drops to 964 millibars.
- 11:25 A.M. Eastern - 976 millibars
- 11:40 A.M. Eastern - 971 millibars
- 11:55 A.M. Eastern - 964 millibars
https://www.windy.com/?2017-10-22-15,24.747,137.988,5
Looks like it's probably headed your way! It might get quite windy on Sunday!
I made this hacky graphic of 6 hours of pressure from Louisiana android phones: https://imgur.com/a/edwz18R
From my Android app that you can download and contribute your phone's barometer data if you like https://play.google.com/store/apps/details?id=com.allclearweather.android
Please stay safe!! And thanks!
Here's a wunderground article. There are two main points that this article and so many other ones mention: warm ocean surface temperatures and low wind shear.
This is a video provided by NASA detailing visual references to both of these. In the video, it shows the very spread out high ocean temperatures. You can see the cloud layer on top of the heat layer.
Welcome! Storms are always far more "fun" to follow when you ~~are afraid you are going to die~~ have skin in the game.
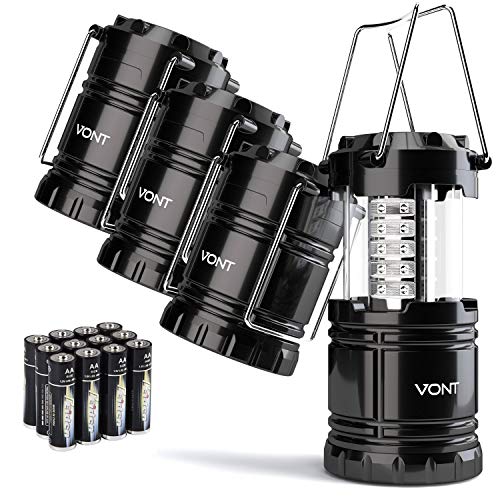
Let's see. Sales tax relief week starts May 31. Get some lanterns like these, which are awesome. And make sure you get flood insurance. If you are renting, make sure you get rental insurance.
Good luck! Hurricanes honestly bring out the best in Floridians, so when the big one is coming, we do pull together.
Tip was likely beaten by Haiyan and maybe some other typhoons. We just don't measure the strength properly in the western Pacific anymore. If you look at the strongest TCs by pressure, all of them were recorded prior to 1987 in the western Pacific (Except for Mike), which also happens to be the year they stopped doing recon flights. https://s.w-x.co/wu/Lowest-Barometric-Pressures-Measured-or-Estimated-in-Tropical-Storms_0.jpg https://www.wunderground.com/cat6/possible-new-world-record-lowest-barometric-pressure-860-mb
<strong>WUNDERGROUND Personal Weather station KLAGOLDE1 at Port Fourchon.</strong>
Air pressure drops to 971 millibars.
- 11:25 A.M. Eastern - 976 millibars
- 11:40 A.M. Eastern - 971 millibars
Hurricanes have a small self produced beta drift. https://www.wunderground.com/blog/JeffMasters/the-beta-effect.html
The majority of what drives where hurricanes go os the environment around them. To that end one storms path doesn't give us much insight to another storm at a similar location.
Wow, I had no idea. Thanks for letting me know! Really heartwarming to see how many folks have already put their places up for free. Here's a link for anyone who might need some shelter and can't get to my place:)
Actually they don’t. Usually their liners are filled with some sand to give them enough weight until they have enough water to stay stationary.
Here is a company who makes them:
Quick Dam Water Activated Flood Bags 1ft x 2ft, 6-Pack https://www.amazon.com/dp/B0085S0612/ref=cm_sw_r_cp_api_p6fTAb78BFQPD
Typical Weather Channel. I still haven't forgiven them for starting the trend of naming winter storms like they do hurricanes. Wether Channel be like: "Oh noes! Here comes winter storm Zeus! We are well and truly fucked with this one, and this time we mean it!!!"
And they're so full of themselves... they have to showboat it every year when they come up with new names: "Winter Storm Names For 2017-18 Revealed".
"Revealed". jfc, it's a list of names y'all picked on a whim, not the frickin Academy Awards.
I don't watch TWC on cable, but when I watched these small videos on TWC site, the met. is clearly saying that Florence will be worse now because of the storm surge and rain dropped. I don't see her saying anything like this will be OK because wind speed is less. https://weather.com/safety/hurricane (see the last 4 videos)
But I get your point and can see that happening. I just am not watching cable so don't see what they are saying live. I can see other cable news stations making people think the danger is less now, or over.
There was a unofficial reanalysis of Haiyan that estimated ~860mb
The authors used three possible scenarios to determine Haiyan’s minimum central pressure based upon the time of the 910 mb measurement from Guiuan when the eye was 28km distant. One scenario employed an average gradient of 3.5 mb/km, another 4.0 mb/km, and another 4.5 mb/km. In the low-gradient scenario, the central pressure of Haiyan was estimated at 866.5 mb; the median scenario resulted in an 861-mb central pressure, and the steep gradient scenario an 855.5-mb central pressure. The authors settled on the 861-mb figure, rounded off to 860 mb.
https://www.wunderground.com/cat6/possible-new-world-record-lowest-barometric-pressure-860-mb
GFS sucks for Hawaii predictions, here's a visual example why.
Euro knows about mountains: https://www.windy.com/?19.556,-155.609,9
GFS does not: https://www.windy.com/?gfs,19.556,-155.609,9
I have a Johns Island live stream and weather station listed below. Still looking at quite a bit of rain and wind.
You'll see what Ophilia might wind up doing on occasion over Canada. Hurricane gets some energy from temperature and wind contrasts, maintains it's hurricane strength winds, and makes landfall as something between a true tropical hurricane and an extra tropical storm. Sandy was a very extreme example of this, but I remember Igor and Arthur being decent examples as well.
Interestingly, these kind of storms are expected to become more frequent over Europe as warmer waters creep close to the coast over the decades. Ophilia is an interesting preview for this, sea temperatures where the storm is now are 1 to 2 degrees C above normal.
If you live on the coast and have a bathtub, I would recommend investing in a waterbob some point. They're like $35, they hold 100 gallons, and they don't take up much room for storage. Flashlights are good, but battery powered lanterns are better light sources for a room. Above all, make sure you have some bug spray.
Also Freeze bottles of water. Use your containers (empty Milk Cartons, Pans, whatever) to fill with water. Have some canned food, Dried Food, Frozen.
Have a Propane Grill, full tanks. for cooking.
One of my favorite sites is the Weather Channel's Hurricane Central. It does a great job of graphically showing the historical path of the storm, as well as the NHC's predicted cone of the storm.
I've learned how to use the other resources over time, but at times I just want to know the basics in an easy to read format.
It's the bottom half of the stretched out low pressure system created when flo went back to sea.. its born of Flo even if we dont call it flo again
https://www.wunderground.com/cat6/After-Florence-Whats-Next-Atlantic
We're definitely not ignoring him, but models are only reasonably accurate to about 5 days, which would put Isaac in the Eastern Caribbean as a tropical storm. Only then would be have an decent idea of threats to the mainland-USA.
You could check out Bob Henson's blog on Wunderground for straightforward Isaac discussion. He's currently alternating between publishing Florence and non-Florence articles.
Weatherbug is showing Delta turn into a Cat 5 before it hits the Yucatan peninsula. Not seeing any mention of Cat 5 anywhere else. Is this an accurate source?
Hello! I'm here!
I am on the west coast in the smoke right now. AQI 250 where I am presently. I haven't been able to follow tropics this week because my own weather has been unusually chaotic.
I do collect pressure data from phones as you describe, and your link is good! I'll be here to answer any questions, thanks for dropping a mention! Direct app link on Play Store; and once you download, go to the app Settings (top left corner, hamburger menu) and Sensors to enable your barometer.
My Laura data analysis is not complete yet so I haven't made good visuals yet for the community, but I am working on it!
Back soon!! Gotta go tape up the tiny spaces in my window sills letting that smokey air in.
Stay safe everyone.
Wilmington in the eyewall of Florence: https://weather.com/tv/the-weather-channel-live/video/watch-the-weather-channel-live
Maybe use the letters A-E to avoid confusion with the Saffir Simpson scale and set it up so it combines storm surge and rainfall flooding into one.
Given that roughly half of all American deaths in hurricane / tropical storm events are due to storm surge (link) I think it would be a good idea.
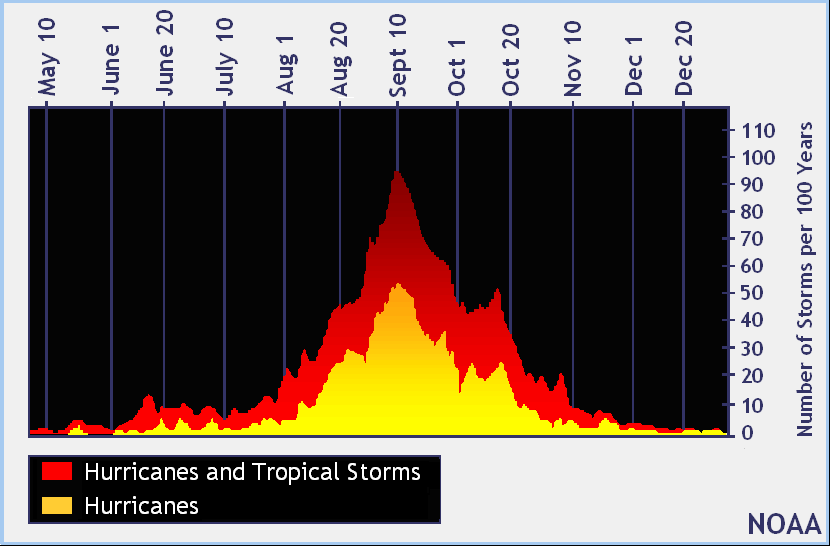
No, again, gulf storms are more common in the latter part of the hurricane season. The season doesn't end until the end of November. Generally, the peak is in September and is beginning to trail off by mid-October. However by absolutely no means is the season over by mid-October for anywhere in the Atlantic/GoM, SE USA included.
See here:
https://www.nhc.noaa.gov/climo/images/peakofseason.gif
Here is a more news-style article that touches on the fact Florida is the most likely state to have an October hurricane landfall:
https://weather.com/storms/hurricane/news/october-hurricanes-florida-threat
Historical data - As a TS Harvey cycled around the 1000 mbar mark, so no record there, but it shows you don't have to set records in all places to set others.
I don't know if you saw this article but it's a nice optimistic outlook for the season
In terms of risk to NOLA and points around there, keep in mind that prior to Katrina, the general consensus was that a large or slow moving Cat 3 hitting west of the city was the "city over" threshold. A Katrina-strength storm was not needed. Even a moderate hurricane hitting on the west is dicey due to the whole "below sea level" thing.
This is a storm surge product showing water above ground in most "ideal" hits from a Category 2. Not all of these figures can occur simultaneously/in the same storm but it gives a sense of the risk an "ordinary" hurricane poses.
https://www.wunderground.com/hurricane/surge/new_mom2h.png
Cat 3 was/is where the defenses fail:
Either this weather station is receiving a world record amount of rainfall, or there's sea water from waves splashing into the gauge. (I'm guessing the latter).
https://www.wunderground.com/personal-weather-station/dashboard?ID=KFLSOUTH11#history
low pressure systems. They're super common and all look like that. What separates the ones below anchorage to the one that became Hurricane Harvey is where they form and the water below them. That nice warm tropical air in the atlantic and carribean fuel the storm and let it become what it is right now. Water is much colder up north.
https://www.windy.com/?pressure,38.342,-92.769,5
you can see the pressure differences here.
Buy some trampoline anchors. I bought these last year for our kids trampoline and they are great. If it's too late to order online and get it delivered, then maybe Wal-Mart or somewhere nearby has some kind of anchors you can use. There are cheaper version of the one I posted via the link, but if not they even have some trampoline stakes.
There are dozens of ways I can think of using ML in weather forecasting. It is a very active area of research. Here is a paper published in the last couple years, Smartphone Pressure Collection and Bias Correction Using Machine Learning by Conor McNicholas and Clifford F. Mass. ML can enable quality, usable surface-pressure data from most new smartphones by systematically discovering and removing biases and doing error correction.
I am using ML in two ways for personal research projects, one of them is barometer related and the other is detection of weather features in all outdoor photos. I am working on both in my Android US weather app All Clear Weather. Privacy is a concern and accounted for in both the above paper and in All Clear, using different methods (removal of location data post processing, doing processing on-device, etc).
In past projects that are no longer active, I collected and processed billions of atmospheric pressure measurements from millions of phones over a number of years. The quantity of potential latent weather data in the world that can be unlocked and made usable by ML is just astounding.
>I doubt ML would be of any real use (or at least any better/more efficient) use than running the equations
The equations are bound by their input variables. We barely input any variables currently compared to what I perceive humanity's capability should be. Dramatically increasing the input variables by using ML to process existing data about the atmosphere directly improves the forecast equations/model output.
ML has a huuuge role to play in current weather forecast research and future weather model improvements.
Hi all,
This is from All Clear Weather on Android. The idea is this: most phones have a barometer in them now (for Google's indoor mapping micro-altitudes) but I want to network them all together in a new kind of weather sensor network.
The code that does the sensor work is open source on GitHub as I encourage other app developers to do something neat like this.
To protect user location privacy, I plan to make 'virtual weather stations' which are small geographical areas that use whatever phones are in them at the time to make statistical inferences about the data. It is possible to get very useful pressure trend data this way, and might be possible to get absolute surface pressures as well.
The barometer feature in the app is in the main Menu -> then scroll sideways to get to Sensors and enable. New versions of Android block sensor access in the background, so the app will show a persistent notification with recent sensor data as it collects it.
I updated the app last night to include an Export feature so you can export your recent raw data and graphs.
You are so correct it hurts.
They've been holding this thing back from switching for over half a century and they know it's eventually going to fail, you can't fight something as powerful as one of the world's greatest rivers, but you can try.
No Twitch stream is needed.
They're playing it live on their website.
https://weather.com/tv/the-weather-channel-live/video/watch-the-weather-channel-live
Very good video on this page:
https://weather.com/safety/hurricane/news/2018-09-12-hurricane-florence-forecast-southeast-us
About flooding, storm surge, what areas will be affected, etc.
Edit: The videos that autoplay after are also good.
I seem to recall most active number of tropical storms was like 12 across the pacific and atlantic
edit:
Four hurricanes have occurred at the same time on two separate occasions:
> "Most recently, this occurred September 25-27, 1998. Hurricane Georges was heading toward a Gulf Coast landfall while Hurricanes Ivan, Jeanne (not the Ivan and Jeanne you remember from 2004) and Karl meandered harmlessly in the central Atlantic Ocean.
> On August 22, 1893, four hurricanes were also active in the Atlantic. One of these was the killer Sea Islands hurricane, which claimed between 1,000 and 2,000 lives in Georgia and South Carolina."
Source: https://weather.com/storms/hurricane/news/eight-tropical-cyclones-pacific-july2017
Can't find anymore info on tropical cyclones. I just seem to remember 12 for some reason.
No, but the trend downward is generally good. Earlier today I saw that the storm was expected to reach 155mph between now and landfall, and now that number has dropped to 145mph (numbers from Weather Channel Hurricane Central - I assume they get their info from the NHC).
Here's what the excellent Dr. Jeff Master's has to say on the subject: >The 0Z Friday runs of our top three models for forecasting tropical cyclone genesis—the European, UKMET and GFS models—had one of them, the GFS model, call for development of a tropical depression in the coming week. The GFS model has been predicting in recent runs what may be a Central American Gyre (CAG)--similar to the one that spawned Subtropical Storm Alberto--to form over Central America, and potentially spawn a tropical depression in the Western Caribbean or Gulf of Mexico sometime in the June 13 – 17 period. About 40% of the 20 members of the 0Z Friday GFS model ensemble went along with this idea, as did the 6Z and 12Z Friday runs of the operational GFS model. Back in mid-May, the GFS model did correctly forecast the genesis of Alberto from a CAG seven days in advance, but only after issuing about a week’s worth of false alarm forecasts. So, until the European and/or UKMET model echo the GFS forecast, we should not pay undue attention to its long-range musings about Beryl forming in the coming week.
If y'all don't read his blog, Category 6, I'd highly recommend it.
https://www.wunderground.com/cat6/harvey-moves-back-over-water-historic-rainfall-will-continue
Solid read regarding the ongoing developments at Addicks and Bayou dams. The ACE is currently releasing water at 4,000 CFS across each damn into the Buffalo Bayou. The max rate is 8,000 CFS but doing so would guarantee catastrophic flooding down the river (which flows into downtown Huston).
Given the evening update of Harvey having moved into the Gulf and turning north-northeast, Huston might be out of the weeds. It seems the rain will keep falling, but the heaviest of the rain bands have moved on from these two reservoir area.
Yes! Title used is almost the same: "2017 Atlantic Hurricane Season Forecast Calls For Less Activity Than 2016"
https://weather.com/storms/hurricane/news/2017-hurricane-season-forecast-atlantic-colorado-state
I have a question, sorry I am a n00b: I was checking out wind maps like this and this and, is it just me, or are there a lot of swirling vortexs that look like cyclones and tropical storms? Below Anchorage, Alaska there is one. Then just across the ocean off the coast of Russia there is one. I also see one in the Pacific ocean not that far from Tijuana. Are these super common and we only hear about them when they hit land? Or is a lot going on right now?
You can still find our book on Amazon: https://www.amazon.com/gp/product/031601642X/sr=1-1/qid=1153015273/ref=sr_1_1/103-7264950-0393402?ie=UTF8&s=books
In its official press releases the NHC counts storms outside o the normal bounds as being part of that year's season.
This would include Arthur and Bertha. The actual season begins and ends with the first or last storms of each year. When a storm forms early or late, it isn't included separately as an off or pre or post-season; it's called an early start or a late finish to that year's season by media. The "official" dates are for the NHC's operations, such as providing an update on the basin every 6 hours. I get what you're saying but you're unnecessarily splitting hairs.
The turbulence at higher altitude is much less (the winds are stronger, but more constant), which is what makes it relatively safe for planes to fly through even intense storms. The lower you go the more turbulence there is, which is why the aircraft fly at a minimum altitude of 10,000 feet. They used to penetrate weaker storms at lower altitudes, but that nearly led to disaster in 1989.
They form off or near the Cape Verde islands, off the west coast of Africa, and they tend to be the very large and intense hurricanes
I'm not trying to be a smart ass linking an article but it will explain it much better than I will.
https://weather.com/storms/hurricane/news/cape-verde-hurricane-season
Not sure about 4 days out, but Tropical Tidbits knew 2 days out (when it was still a TS) that it was going to stall with 15"+ rain: https://youtu.be/hz8wu_gWbUc?t=4m32s
By the next day (day before landfall) the blog Cat 6 was calling for 2-3' of rain in areas over 7 days and flooding in San Antonio and Houston.
Great idea!
Two ideas here...
Pretend It's XYZZY can be played on mobiles together. It's a Cards Against Humanity clone and can get the laughter going.
Roll20 lets anyone host D&D and other tabletop games for free.
Even just storytelling can give folks a break from reality. Plenty of other games you can do both in-person and over the net. Get some Discord bots that have games like Trivia and make specific chat channels for them.
Weather radar shows only light, intermittent showers in Corpus Christi, Rockport, and Port Aransas.
However, farther NE along the coast, the amount of rain increases heavily around Bay City and Lake Jackson.
Found this: > La Niña events tend to support hurricane development in the Atlantic by fostering subsidence in the eastern Pacific and decreased upper-level wind shear over the Atlantic.
9:10 P.M. IST (India)
9:40 P.M. BST (Bangladesh)
15:40 UTC
11:40 A.M. EDT
This will be my last update (unless there is considerable demand for another, which I doubt).
There's a lot of AirBNBs in the area that are free right now and AirBNB is waiving all fees for people evacuating from the Houston/surrounding areas.
This storm has not intensified nearly as rapidly as others we have seen (Hurricane Patricia is an extreme example: winds increased from 85 mph to 200 mph in just 24 hours), but what has been remarkable has been the steady increase in intensity over almost two days without pause. I don't recall another storm like it.
Low pressure and storms make a tropical depression. The lower the pressure, the worse the storm will be (which is why the pressure is measured). If a tropical depression gets worse, it becomes a tropical storm, which can worsen to a hurricane.
I'm not a meterologist, but from what I understand, the lower pressure is much more relevant to how bad the storm will be than, say, how big it is (# of miles across).
Found this link with the differences between tropical depression, tropical storm, and hurricane: https://www.accuweather.com/en/weather-news/whats-the-difference-between-a/34388
Advisory #49: Dorian has weakened back to a Category 2 hurricane. Wind speeds are now 110mph (175km/h), with gusts of up to 130mph (215km/h).
The eye of Dorian is currently here: https://snipboard.io/GYuM0o.jpg
I've had to deal with conference calls between Asia, Europe, and all NA timezones as well as Australia...
World time buddy is definitely my friend! Just put whichever timezones you need in, and it highlights times/dates for you.
Look at the cone, though. Nearly all the models show an immediate northeastern curve after landfall. Most of Louisiana, Mississippi, and Alabama are in the cone. Unless something changes very soon or you're just a big fan of rain, you're better off going west. https://www.wunderground.com/hurricane/atlantic/2021/hurricane-ida
ICON is one of the global models for forecast predictions along with the ECMWF and GFS, and UKMET
The ICON model is is based in Germany.
Here’s a Weather Underground article that shows objective performance for a previous season.
Note that this year we’re using a brand spanking new and improved GFS model and we’ve yet to see what it can do.
Note also that everyone kinda sucks at modeling intensity, but we’re reasonably good with tracks.
Here's one from TWC's Hurricane Central. Doesn't go past the US, but it does a good job of showing it from potential cyclone to exiting the US. National Hurricane Center data for each point can be seen on the right -- click on a different point and it will change.
I know this sub likes to rag on TWC, but I really like this specific page on TWC for tracking hurricanes.
Just so you and /u/steezefebreeze are aware, the Waffle House are actually planning to be closed for Michael
Maybe this update will be helpful to you:
https://weather.com/safety/hurricane/video/south-carolina-keeping-close-eye-on-hurricane-florence-as-storm-nears-the
After 1:10 at the end she shows the rainfall map. I feel like high rainfall and flooding are the biggest threats, as well as power being out for some time. It seems like wind speeds are less than predicted. I am not an expert though.
https://weather.com/safety/hurricane
I would follow this webpage and watch the updates tomorrow. good luck and be safe.
And, of course, any local new stations should have the most local info tomorrow.
It's hard to compare storms that have a much different impact. At ground zero it's fair to say that Michael was incredibly destructive. Luckily it was pretty compact and the area it hit is less populated. My only criticism of OPs post is that the storm surge of Katrina was absolutely insane with miles and miles of devastated coastlines. https://www.wunderground.com/education/Katrina_surge_intro.asp
I'll agree that Mexico Beach was hit as hard as the LA/MS coastline in Katrina, but the area of coastline impacted was much less.
Very warm and there's two loop current eddies in the gulf at the moment: https://www.wunderground.com/cat6/High-Octane-Hurricane-Fuel-Gulf-Mexico-2-Loop-Current-Eddies This is from July 24th, but the eddies are still there. Of course other conditions have to be right to allow for organization and intensification.
There was just so much data collected last year and at least according to this the track predictions were their best ever in 2017.