
What are Reddit's favorite Fan Speed Apps?
HWiNFO (32/64)
SpeedFan
MSI Afterburner
Open Hardware Monitor
FanControl by Rem0o
iStat Menus
Sidebar Diagnostics
Stats
ASUS GPU Tweak III
smcFanControl
Lm-Sensors
Argus Monitor
Top Reddit reviews mentioning Fan Speed Apps:
...Downvoted for a giveaway? Thanks guys, great way to make me post here again :P
I can't play the closed beta right now since my desktop is at my new home (we're moving) so I figured I'd give it to someone else but wow.
EDIT: Holy crap, you guys are awesome. Since there is a lot of demand for my wallpapers, all I did was go to Google Images and search for "bokeh" which is an effect in photography. These are the ones I am currently using.
Do you know which piece or pieces are receiving the most heat? If not, I highly recommend HWinfo. It was a godsend when trying to figure out what was heating up in my own case and I found out it was my video card.
It's a pretty easy and comprehensive tool! Best of luck on your path forward.
Sidebar Diagnostics, based on Open Hardware Monitor, is also a pretty neat tool: https://github.com/ArcadeRenegade/SidebarDiagnostics
As the name suggests, it displays system stats in a sidebar on your desktop.
If you have a second monitor i recommend this Sidebar Diagnostics
You can see pictures here
I assume you've researched the card well, but I'll still throw in some tips.
- Look into undervolting the 3080 (or whatever some pedantic people call it). My FE ran cooler, quieter, used less power, and gained a few FPS overall.
- Check the VRAM temps using HWINFO64. My memory hit 106C during heavy games like RDR2 and Control; throttled for Quake II RTX. If your card gets super hot and are comfortable with taking it apart, then I can help you with the thermal pad replacement.
- Custom 12 pins look sexy as fuck.
There's an open source free alternative called Stats, or similar alternatives.
iStats also have a paid upgrade model.
Should be known sooner than later, The author of HWiNFO mentioned that the deviation metric is available in HWiNFO v6.27-4185 Beta
Many people in the small form factor PC arena already do this, me included. I have deshrouded my Gigabyte Gaming 3080 OC and replaced the stock fans with 3x NF-A9x25 fans controlled using the incredible FanControl software. Now my 3080 runs 10 degrees cooler and is utterly silent.
Sure, we don't have a full Noctua themed shroud, but most of us will 3D print our own shrouds to hold the fans in place, so kinda similar.
A reddit user made this application which monitors hardware info and displays it on the screen. Especially useful if you have a second screen.
Sorry for the long post but maybe it's relevant to your issue as well.
The stock CPU fan for my i3-6100 failed after a little more than a year, it would intermittently fail to start spinning but once it was going it would stay on. I first noticed this because of 90-95C temps in games and even had the system powercycle presumably due to CPU heat.
In addition to the MSI Afterburner/RivaTuner in-game OSD I started using OpenHardware Monitor with its Windows Desktop Gadget and temp history plot to track temps and fan speeds and noticed the CPU fan often wouldn't come on when powering on the system or resuming from sleep and I'd have to physically tap one of the fanblades to get it spinning again. I also noticed that when I disconnected the fan and would manually spin the blades it would feel "notchy" in a certain range of the rotation which didn't feel right. I suspect this is where the fan would sometimes come to a stop and the initial burst of power sent to the fan when turning on the system wouldn't be enough to overcome the resistance and initiate rotation.
If you're satisfied that your CPU fan is working fine now, or that the issue was user error (e.g. failure to connect the fan (we've probably all been there)) that has since been fixed then you're probably OK but if you didn't pin down the issue with the fan I suggest monitoring the speed, perhaps keeping the case's side-panel removed so you can actually look at the thing and maybe consider replacing the fan via a warranty claim or aftermarket part. I ended up getting a cheapie Rosewill fan which has been working fine and even runs a few degrees cooler.
Even though a CPU is designed to protect itself from heat it's still not good for the system as a whole if it has to powercycle so it would be smart to keep your eye on temps and fan speeds until you're satisfied everything is fine.
I went back in time and looked at HWiNFO changelogs to find the first mention of Zen/Summit Ridge ~~in version v5.32 on 7 June 2016, 11 months before Ryzen went on sale:~~ >Enhanced preliminary AMD Zen support.
Later Edit: Actually, the first mention of Zen is older than than, it was in 14 October 2015 in version v5.06:
>Added preliminary recognition of AMD Zen (Summit Ridge, Raven Ridge).
There's a chance the pump died. Check your BIOS or use some reliable software like HWiNFO which will report your pump speeds. If it's 0 RPM then time to RMA that AIO.
Read this: https://www.hwinfo.com/forum/threads/effective-clock-vs-instant-discrete-clock.5958/
Effective clocks provide an accurate indication of what the cores are doing, in my opinion.
Core clocks are like the top speed shown on your speedometer.
Just some general tips for a new gaming laptop, nothing super specific to Razer:
- Make sure you monitor the internal temps. I use MSI Afterburner for this, it has a nice on screen display of CPU temp, GPU temp, framerate, as well as many other things.
- If your temps are over 85C, it'd be a smart idea to undervolt. At 85C, you're laptop will be close to thermal throttling and will not be good for the longevity of the laptop. Follow this guide to undervolt
- Make sure your fans are not obstructed by anything. If you're ever going to connect your laptop to an external monitor, it'd be a good idea to buy a laptop stand that props the laptop up to increase airflow.
- Not a bad idea to remove the bottom panel and clean out dust with compressed air every 6 months or so
MSI afterburner can graph various things about your hardware including temperatures, fan speeds, memory/gpu/cpu frequencies, cpu/gpu/memory usage, power/voltage and few other things. The beta version has those graphs in overlay too but the normal version can sow the numbers in overlay.
> Instead, I would propose the temperature calculation (for cooling / fan speed purposes) to be like this: > > Actual Temp in C + (100 - Load in percentage) * 0.1
Or just use Fan Control which is amazing software that allows you to set hysteresis and delay when you fans speed up among many other things.
Motherboards might not, but there is a nifty utility called FanControl that will let you assign any temperature sensor it can see to any fan it can control. There is also a plug-in that allows you to assign sensors that it can't see but HWiNFO can. I believe that it can see telemetry from *some* AIOs.
Well, that's your first problem.
Install: https://drivers.amd.com/drivers/amd_chipset_drivers_v1.07.07.0725.exe
Next, you need to use this one version of HWInfo64 that supports Ryzen 3000 fully:
https://www.hwinfo.com/files/hwi_609_3855.zip
... HWMonitor is garbage software, don't use it. Only use HWInfo64.
These fans made a massive difference to my Meshify 2 Compact case. I used them in conjunction with Fan Control software and my gpu temps when gaming dropped by a staggering 15°C! Because these are PWM fans I used the software to ramp up my case fan speed as my gpu junction temperature increases. Just make sure to set your curves to avoid the 900-1100rpm range because these fans tend to make a whirling noise at those rpms. Anyways, if you're looking for a way to control your case temps, cpu and gpu fan profiles then I highly recommend these fans and the Fan Control software. It's like SpeedFan but better. The github for the program is https://github.com/Rem0o/FanControl.Releases
Open Hardware Monitor hasn't had a release since 2016 (so, no Ryzen support), and based on github activity it really hasn't seen much development at all in the intervening time even if you were to pull the code and build it yourself. HWInfo would be a better option, though it's not open source.
Skip MalwareBytes. Defender built into Windows is very good already. Leave it turned on.
Ram can be easily tested with MemTest86.
Can you recreate this crash? Perhaps the laptop overheated? Temps can be checked with HWiNFO64.Have you used any CPU/GPU tuning software? If yes, then open the software again and clear all set values to defaults.
Update Intel chipset+iGPU drivers and Nvidia drivers.
Don't use HWMonitor, as it's known to give bogus readings. Use HWiNFO instead.
If the temps are high in hwinfo as well, is your cooler installed correctly? If it's an aftermarket cooler, did you remove a plastic film if there was one?
> I want to know how to capture a high quality PNG .
Simplest way? Download MSI Afterburner - ignore the bulk of it - but go in to the settings and set up the "screen capture" tab.
Keep it running while playing SC and you can take a screenshot using the key you designated which will save to the folder you designated.
The screenshot will be the same resolution as you set the game up to run in.
If you want to force high quality screenshots...
...say (6K or 4K) despite not having a monitor that natively plays at that resolution, it gets a little more complicated. It's possible to do it using nVidia DSR or by setting the user.cfg file to allow higher resolutions than you could normally play on.
This can be tricky to get working and (for me) results in crashes.
iStat Menus Paid
It's an amazing little app that shows you CPU usage, RAM usage, etc... almost any stat you want, in your menu bar. I've installed it on every Mac I've ever had.
Use HWInfo64 to monitor the "Tdie" temperature (actual temp at the processor die to the heat spreader that your cooler is sitting on). Once you open HWInfo64, click the "Sensors" button. "Tctl", which has a +10c offset, may be what you're seeing in Ryzen Master (I've not used Ryzen Master since a 1500X I setup last year, but it did report the Tctl at the time).
Grab openhardware monitor. https://openhardwaremonitor.org/
Run it
Play a song or two on beatsaber, once it starts lagging take your headset off and tab over to it.
Check to see if it's system temps throttling.
Other thing to check is to make sure your vive's HDMI cable is plugged into your dedicated GPU and not your onboard. It's a simple thing people sometimes forget, even us tech savvy folks.
No, the mechanism was falsifying the current reading. Not the TDC or the EDC limits. The measurement, directly.
The CPU's FIT system, functionally, is a map of temperature to safe current, assuming some particular desired lifespan.
Falsify the current, and the CPU will request more voltage ("overvolting"), draw an un-safe current, and shorten its lifespan.
180F (82 C) is high but not bizarre for a laptop. That's probably the core temp, and the internals will be lower. It might be a good time to clean the fans and replace thermal paste though. 210 F (a bit over 103 C) is in the danger zone. The silicon can take it, but nearby parts may be damaged.
You can use a program like stats to look at the temperature of the other dozen sensors. It has fan control too, so you can crank them to maximum.
Might I followup with the original technical JPRS report, the Chernobyl Notebook, also written by Medvedev prior to writing the "truth about chernobyl".
Reading it made it clear how many levels of idiocy were involved in the disaster.
Make sure you're following your FIT voltage.
​
Use HWiNFO instead of HWMon as HWiNFO is way better maintained and more accurate.
One thing where they mention about hardware monitors reporting nonsense numbers because they don't know about a particular bit of hardware, on PC there's huge amounts of variations on different parts, so the developers of the software need information to improve it.
HWinfo for certain will take reports generated by the application to get your sensors correct, and you can do so on the forum. When you see "Enhanced monitoring of..." in the changelog for a particular model, it's likely someone supplied the information needed.
Because the fan controller is expecting both fans, the card sees the missing fan on the second header as a fan failure and runs the card in emergency mode, which runs the functional fan at 100% all the time to try make up for the (assumed) non-functional fan.
Either connect to the motherboard and control using userspace software like the amazing and free FanControl, or get a second adapter and connect the second fan to the second port rather than splitting them both off the first port.
Check your CPU/GPU temps, especially when playing - problems that occur when gaming are often (but not always) heat related, as that's generally when your PC is under the highest strain.
If the temps seem fine, try testing your RAM as /u/CarbonRevenge suggested.
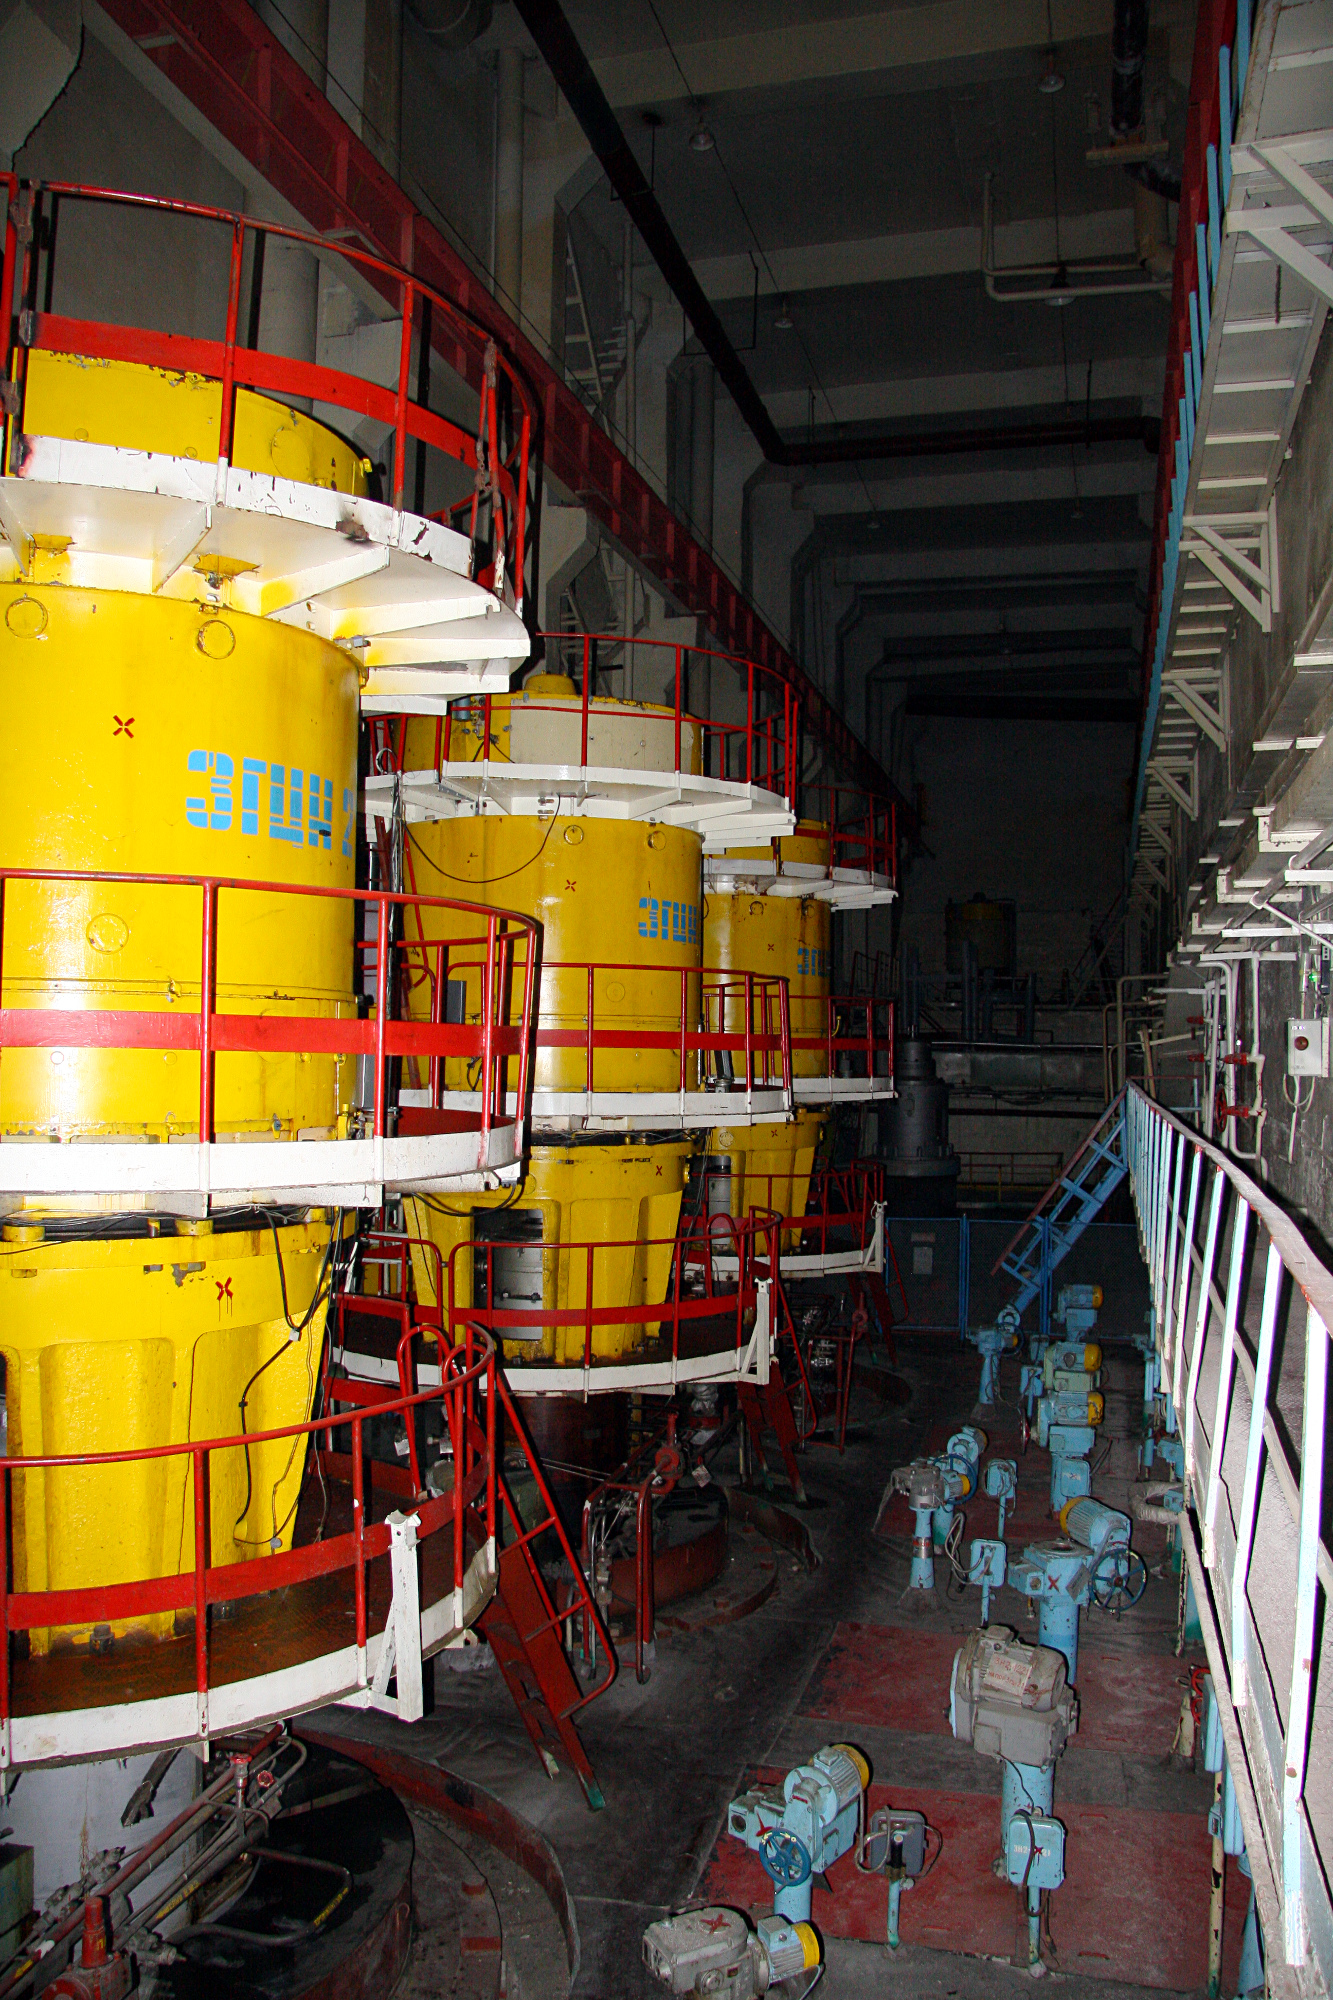
They do look somewhat similar to Main Circulatory Pumps, and that might be it, however it is possible that these are in fact smaller Feed Pumps (below and beneath the MCPs), but they actually might be located underground.
Check out this post on the topic: https://www.hwinfo.com/forum/threads/effective-clock-vs-instant-discrete-clock.5958/
> While this method still represents actual clock values and ratios reported match defined P-States, it has become insufficient to provide a good overview of CPU dynamics especially when parameters are fluctuating with a much higher frequency than any software is able to capture.
Basically, newer CPUs are so complex that software can’t really accurately measure their true performance using older methods (discrete clock speeds).
For example your CPU may boost up to 4.9 GHz for 1/10th of a second. Did it truly run at that speed? No, clock speeds are a measure of cycles per second, a processor that increased its speed to 4.9 GHz for 10% of a second while being turned off/idle for the other 90% of that second really only effectively ran at 490 MHz. Older programs showing discrete clock speeds however would show you 4.9 GHz instead.
Basically, effective clocks are the more ‘accurate’ way to measure a processor’s clock speeds as they increase in complexity.
Ok, something is wrong here, you should be getting way better framerate.
So let's do the usual:
Download DDU and run it in safe mode and make sure all boxes are ticked. This will clean sweap your GPU drivers. Restart so you get back into user mode after DDU has uninstalled the drivers successfully.
Install the latest non-beta drivers from Nvidia's website then restart the PC.
Go to Gaming settings in Windows 10 and disable GameBar.
Run the game and it should be much better, if not:
Go to the .exe of the game, right click it and go to Properties > Compatibility and make sure that "Disable fullscreen optimization" is checked (forces the game into proper fullscreen, otherwise it's in a hybrid fullscreen/borderless mode). Easy way to see that it's working is by changing the volume while ingame. If you don't get the volume slider overlay, it's working.
Get MSI Afterburner so you can check how much resources are being used and how hot your hardware gets.
If your CPU runs hot (hotter than 80 during load) you should re-apply thermal paste.
If everything runs hot, make sure you have a good airflow in your case, open the side panel and run it (can be opened while it's on, won't get shocked)
I don't think there's any real bottleneck in the system, but if that's the case it's definitely the RAM and CPU. The i5-3570 was bottlenecking the hell out of my RX 580 (on par with 1060) in most games, but the 4670K should do a better job. If all else fails, you'll want a new CPU.
You can certainly overclock it.
Download MSI afterburner from here https://www.msi.com/page/afterburner
Just increase the sliders on everything a bit. Keep doing it until you start noticing crashes or freezing in whatever program you're stress testing with.
I use this guy on my second monitor! https://github.com/ArcadeRenegade/SidebarDiagnostics
It's kinda similar to what you have there but it displays on my monitor.. It shows you specs, clock speeds on your cores (you can choose which cores iirc) RAM usage out of overall, all drive info and network speeds. As well as time, and day of month. :)
quick gyazo shot: https://gyazo.com/c546155064b9c467731f1769318ca3da
edit: you can change the coloring of it to anything of your liking as well, that's just how I have mine
It's called Sidebar Diagnostics. It was made by a guy on this subreddit and is basically a hardware monitor
You can do that all with Fan Control and the hysteresis option it has built into it.
I've optimized all my fan curves and I very rarely notice my fans ramping up or down. My CPU is completely inaudible (5600X undervolted with a Fuma 2 cooling it) and my GPU is loud while gaming but at least it ramps up much nicer than the stepping it used to have.
You can even have your case exhaust fans ramp up with the temperature of your CPU. It's real nice.
I did this with my previous Gigabyte 2060 super.
I used the software FanControl to have them connected to the board but still use the graphics card temps as the trigger for a curve to regulate them. I struggled a lot to find something that did this as it was the only way it made sense for me. Lots would control the fans but based on some other temperature sensor that was not on the gfx card.
Fan Control is fucking brilliant, really simple even free, though the dev accepts and really deserves a beer or five.
Just to be clear, you formated the hdd recently? After the maleware was found?
What exactely do you mean by "sudden shutdowns"? The PC just goes blank?, or does the OS shut down? What OS are you on?
Did you measure temperature and/or voltage inside the PC? For Windows you could use a tool like SpeedFan to do that - if yes what values do you get?
Does the problem happen in your active OS only?
> I've also heard it can destroy ur Graphics card or something
The only issue with laptops is they tend to have poor airflow, and heat is what degrades components. However, it's not as if you run a game that's "too heavy" and break the GPU - you'll just get unplayably bad framerates or won't be able to launch the game at all.
Just download some form of temperature monitor software - something like Open Hardware Monitor will work fine - and keep an eye on CPU and GPU tempatures. Google around and see if the manufacturer/knowledgeable people have recommendations for operating temperatures, then just make sure your temps are at or below that. If they're below what's considered "healthy," you're fine. If they're above, either know you run the risk of reducing the lifespan, or skip playing that game.
In general, you can get different readings especially if you're using 2 different softwares at the same time, stick to one at a time. Otherwise it's actually reading 1.4V on vCore. I myself had issues on my Crosshair VI Hero, and one day found the CPU to kicking out so much heat, checked hwinfo and it was 1.7-1.8V, a restart and a bios flash fixed it.
I and most other people use HWiNFO64, CPU Core Voltage (SVI2 TFN) is what you should look for in general. If you really want to be precise, get yourself a multimeter and read it from the voltage points or socket.
Martin authour for HWiNFO talks about here , if you see a different voltage between what the motherboard and CPU is reading for voltage.
Every card is different and also have different memory (samsung, hynix, elpida, micron), but you should get around 12-14 Mhash with any RX 470/480/570/580
You can check which memory you have downloading GPU-Z (TechPowerUp)
This is my guide to OC in radeon software.
Base values for Samsung 1200 MHz / 930 V core 2000/850 memory
Hinyx 1050/920 core 1800/850 memory.
Download HWinfo, open it and run the miner, look closely (on hwinfo) if you get any memory errors for about 5 minutes, turn down the memory clock by 50 MHz. Close HWinfo and miner, then open both again and repeat. When you stop getting memory errors, let HWinfo running, and check after some hours.
The core have a peak performance, you have to find it, lets say you're at 1050 MHz, and getting 12 MHash, go up 50 to 1100 MHz and now you get 14 Mhash, then go up 50 (1150 MHz) and you get 12 Mhash again, the peak will be close to 1100 MHz, so then you go 10 by 10 up or down.
Great, I am also interested in that variant. Unfortunately I couldn't order as amazon doesn't deliver in my city due to lockdown. I am waiting for stocks to arrive offline stores.
Can you post screenshots of detailed specs using something like HWiNFO? I am interested to know the model number of the lcd panel they are used in Indian variant. Also what is the 512GB SSD they are using? Thanks
MSI Afterburner + RTSS that actually draws the overlay. Both are bundled together when you download Afterburner.
So your integrated graphics is your bottleneck. I'd recommend overclocking your graphics using MSI Afterburner, but that will only give you at max 3-5 more FPS.
If you really want to significantly improve your FPS, there's no other option other than to buy a discrete GPU. An RX 560 or a GTX 1050 will yield double the performance than your integrated graphics.
Is it Catalyst?
To be save, head to ATI's driver site and enter in the info for your specific card once you've nailed down what it is.
Not sure what their driver situation is like in terms of beta drivers (I've got an nVidia) but see if there's a manual driver update available.
If the card is clean, drivers are updated, and you're still getting this issue, grab Speedfan and check your temps while playing. If you have to, up the speed on the video card fan and see if that helps.
If you're still having the issue at that point, I'd either look at replacing/reseating the stock heatsink on the card, or getting a new card altogether if you aren't comfortable with that.
I would not have a five year old clean my CPU, and I don't think the average user wants to go through such extreme measures.
EDIT: To elaborate, since the cpu does so much all the time, it gets really hot as it works. Special thermal components called heatsinks are designed to dissipate (get rid of by spreading it out) heat. If your CPU's heatsink doesn't do a good enough job, then the CPU will automatically slow down, to prevent overheating.
If you want to clean your heatsink: Turn your computer off. Do not detach the heatsink from the motherboard. If you detach it from the CPU, you will have to reapply your thermal paste (which is a tedious and potentially computer-part-breaking process involving clearing the old paste off of both the CPU and the sink, then carefully reapplying it). Take a q-tip and wipe out between the plates, removing as much dust as possible. Some people will say to use compressed air, but I have heard arguments against this, since you're really just pushing the dust somewhere where it will be harder to get out. The important thing, either way, is to remove the dust, since the dust is reducing airflow, preventing fresh cooler air from contacting the plates.
You only want to try that if you run something like SpeedFan and find that your cpu is running at a temperature higher than say 70F when your cpu is idle.
By idle, I mean when it's not doing a lot of stuff at once. You can check this by pressing ctrl-alt-delete on windows xp, or ctrl-shift-escape on 7/vista. When the task manager appears, look under performance. Watch the graph labeled CPU for at least 45 seconds, so that it stabilizes after it loads the task manager. If the cpu usage is below about 30%, it's idle (sort of, it's still doing stuff though, just not as much). If your temperature is high while the cpu usage is low, you have a cooling problem. If not, the problem lies somewhere else.
Alright mate here's what I want you to do so we can actually help you instead of trying to assume off of the back of your IO.
Download either
or
Upload a screenshot of the summary page in either of them to imgur and link me & the rest of the thread to the screen then we'll be able to determine what your setup is and go from there.
Roger?
Sounds like everything is running fine, so I believe you can put your worries to rest. For peace of mind, you can install some monitoring software like HWiNFO, MSI Afterburner or CPU-Z/ GPU-Z that you can pull up occasionally to check info on you equipment. You can set it up so you have temperature gauges that show on your task bar or integrate into other desktop monitoring HUDs. You can also get FPS, clockspeed, temperatures, etc to display during games via RivaTuner (which you can set to a hotkey to turn on and off as you please).
Just so you have an idea of what I'm talking about, this is what a setup with HWiNFO might look like. You'll have displays for current, high, and low numbers as well as graphs. This way you can see if your machine is hitting any particular stress points and for how long.
If it's not a K-series CPU on a Z-series board you can't overclock it.
As for why it's slow, could be a lot of things. Do you have a video card? Is your screen connected to it? Is the driver for it installed? What is the type of the GPU?
Is your CPU running at a reasonable temperature? Use Open Hardware Monitor to have a look.
1 to 3 are indeed kind of essential. After that the OP should check the performance to see if overclocking is worth the time and risk, especially considering we are talking about a laptop, which generally means less than optimal cooling.
There's a little utility program called Open Hardware Monitor that can help monitor temperatures and CPU/GPU load to check for thermal throttling
Ryzen Master shows effective clock speeds, which is different to what CPU-Z reports. You can check them on HWInfo too if you use the sensors-only option at launch. To understand the differences read this link.
About the lines you mark on the picture, the top "peak speed" shows the highest effective clockspeed in that precise moment, while the lower one shows the peak speed achieved over a period of time (from the histogram).
You should download this program (HWiNFO) https://www.hwinfo.com/download/
It will allow you to monitor almost every component... To include your ram, m.2 drives, etc., And it will tell you the average temps over a period of time, so you'll know what happens when you're sleeping.
Do you also have a RX 6000 series GPU? The author has released 6.43 Beta that fixed the issue. I used to have the WHEA error all the time until I saw this thread on the HWinfo forum.
I have updated and so far not a single WHEA error for a week.
You mentioned your fans are at full speed, I'd say either your CPU cooler/fan has shifted and isn't contacting the CPU properly or the thermal compound has dried out. You can monitor temps with hwinfo.
If the compound has dried out keep your PC in low power mode if the temps are safe at that level and get some compound. There's plenty of application videos on youtube. MX-4 is affordable and good.
Yeah that's not good. You're probably experiencing some thermal throttling due to the high temperatures, which lowers performance.
I'd recommend installing MSI Afterburner so you can keep an eye on your temps. It's nice because it has an on screen display, I have mine set to show CPU temp, GPU temp, and framerate in the top left corner.
As far as cooling your laptop goes, definitely make sure the fans are not obstructed by anything. But, in my experience, laptop cooling pads to next to nothing to lower temperatures. I'd recommend following this guide on undervolting your CPU. It should drastically help lower your CPU temp and help your PC last longer
Download setup.exe here and just run it: https://github.com/ArcadeRenegade/SidebarDiagnostics/releases
Github usually provides the source code at a raw level, and sometimes a separate installer for those who don't really care about the code.
Sidebar Diagnostics is pretty cool. Customisability is high, and it looks nice.
Here's an old pic of my sidebar. I have it on the right of my right (non primary) monitor, and it's useful to keep track of temps and ram usage.
No offense but that wallpaper has a low resolution.
Also there's too much shit going on at the same time
You might consider Side Bar Diagnostic for a cleaner look
application called smcFanControl, allows you to set a custom fan baseline for the curve, meaning you can make your fan go faster than it would in some situations. This is important in macs because despite the fan hitting 100% around 80C macs don't cool down very quickly. It is better to prevent it from getting that hot in the first place. Also it's better for the lifespan of the computer. And for why it's getting hot, idk, that's just what macs do. Also you don't need to be worried about the hardware unless you are running super intensive games for like 5 hours straight. the CPU will throttle as well as the GPU to prevent overheating. I have a 2014 MBP 13" that I have pushed waaaaay past the limits of what you should do with a baseline mac.... no hardware damage, I did recently change the thermal paste on it, and that improved performance and thermals, but a 2017 computer should not need new thermal paste. it's just that mine was 5 years old, and you should change thermal paste every 3-4 years.
​
Github link to SMCFanControl
You can use Fan Control for setting the fan curve, it allows you to use GPU temp as target for motherboard fan headers. https://github.com/Rem0o/FanControl.Releases
For connecting the fan to GPU headers, you can cut the connector to fit. It’ll work fine as long as you don’t damage the contact point and wire.
Use this: https://github.com/Rem0o/FanControl.Releases
Been using it for a while and it's one of the few open source projects that I've donated to. Works flawlessly. I hope if it works for you, you can also consider sliding him a few bucks cause the alternative is speedfan which is dead
Was pretty straight forward, then again i been doing that for years.
The fans are plugged into the motherboard via a 3-way y-splitter, and controlled with FanControl https://github.com/Rem0o/FanControl.Releases
This allows you to select GPU as temperature source.
You should be able to change the your fan speed curves in BIOS.
In BIOS, while in Advanced Mode, pressing F6 should bring you to QFan Control, it's where you should be able to set a fan curve for your fans. You might need to change the AIO Pump Header and SYS Fan Headers to PWM mode first, and that can be done in "Monitor" Tab in the BIOS.
Software wise, ASUS has their own software called AISuite/FanXpert, if you are inclined to use their clunk.
Personally, I use a software called FanControl after setting the headers to all PWM in BIOS.
Hope that helps!
> 4.5.0 NVidia 365.10
Your driver is a bit old. The current version driver is 368.81. This won't make a massive difference, but is a good idea to keep current. I'd suggest installing GeForce Experience to help you keep current.
> D:30
Here is the main issue. At the default render distance of 0, the game keeps 441 chunks loaded around you. At your setting of 30, the game must keep 3,721 chunks around you loaded. This will create considerable strain on the GPU, CPU, and when you move the Hard Drive. If you reduce this setting (try 10 as a test), does your FPS increase significantly?
> GTX 970M
I see you have a laptop. Temperature of the GPU is critical to performance. Do you have a temperature monitoring tool to see if your performance correlates with temperature? If not, I'd suggest SpeedFan.
HW Monitor is a great application, it can monitor just about all temp sensors, fan rpm, etc. Another good option is speedfan, which requires some setup and is great for controlling fans based off temps.
My build has a AMD Phenom II 1090T OC'ed to 4GHz, with temps ranging from 20C to 35C max, in a 70F or so living room.
Had a similar problem. The cause was the cpu heat sink had become loose. I took it off, gave it a thorough clean and re applied with quality thermal paste and haven't had a problem since.
You can check the temps with speedfan.
Take a poll with Speedfan. If your drives are reporting >40°C idle temperatures, then their lifespans are going to be shortened. Personally, I would be worried about my data.
The hwinfo author explains it differently as I said measured by the vrm not the cpu
CPU Core Voltage (SVI2 TFN) value is the voltage measured by Voltage Regulator, which is supplied to the CPU (as VRM output)
https://www.hwinfo.com/forum/Thread-Ryzen-CPU-Voltage-explanation
Speccy is shit and I wouldn't trust anything by Piriform anymore. Use hwinfo64 instead.
Yea, see Martins (Dev of HWInfo) comment on that: https://www.hwinfo.com/forum/Thread-ASUS-Prime-X470-Pro-Fan-headers-shutting-down-after-a-while-when-running-HWiNFO?pid=18244#pid18244 > ASUS continued investigation and developed an alternate solution that should completely fix this problem. We spent a lot of time with them working on this, I was directly involved in this process. We came with a solution, which however wasn't yet released by ASUS as part of an official BIOS. So HWiNFO has support for this already, but you will need to wait for ASUS to release the fixed BIOS.
On paper the x370 pro looked really good when I got it but the software and bios situation was a shitshow in the beginning, now its better but still bad.
The processor is actually great at throttling such that it doesn't overheat, so you might not notice it. You can use HWINFO to check if you're actually throttling at any given moment :)
Kernel Power is a somewhat generic error given when the computer shuts down unexpectedly.
Many AMD CPUs have some heat issues; I'd suggest downloading some monitoring software like HWiNFO and watching your CPU temperatures while playing, if you haven't already. Aside from that, I'd suggest checking your cable connections between components, and making sure your PSU supplies enough power for your components.
I myself have actually had a very similar problem with an AMD FX 8350, which ended up being caused by overheating despite the CPU performing well otherwise.
I am curious what your memory error count on this mem OC is. I wouldn't be surprised if it is millions per minutes. At least, that is what i get when i try to overclock more then 2100 with only 1 volt.
Take a look at the memory errors with HWInfo64.
I don't trust anyone who advises you to install CC cleaner lol. It's an intrusive software that does more harm than good. You can do all it does manually.
Don't OC your cpu if you don't have a good cooler, use this to check temps. If you are getting temps over 75° the life spam of your cpu will be shorter. Over 90° you're literally killing your CPU (most of them).
You don't need to OC you gpu. The game is cpu heavy, not gpu heavy (unless you're running high settings).
Also, mouse raw input is integrated with Fortnite so no need to disable mouse acceleration manually.
You can determine this yourself by downloading HwINFO and checking the "number of bank groups" [screenshot].
2 bank groups = 1Rx16
4 bank groups = 1Rx8
Entendi.
Além das sugestões do tópico, era bom você ver como está a questão da temperatura do processador e da placa de vídeo. Se estiver esquentando demais, o sistema abaixa a performance automaticamente para evitar danos por sobreaquecimento.
HWiNFO fornece praticamente todas as informações do seu PC além de detalhes de sensores, como rotação de ventoinha e termômetros.
Where are you checking that speed? Cpuz/taskmanager probably right? Dont look at that, thats just the discrete clock speed/ratio the cpu is running at.
Download ryzen master or hwinfo to check the effective clockspeeds.
You can read more here:
https://www.hwinfo.com/forum/threads/effective-clock-vs-instant-discrete-clock.5958/
Most likely temperature problem.
Download HWInfo, and check temperatures while you are gaming.
Best way to tell if it's heating problem is to stress test CPU and GPU, with softwares like Prime95(CPU) and Furemark(GPU), that will immediately tell you what's wrong.
I am on my phone right now so I am a bit limited and don't have access to my screenshot and log files. But you can check the thread if you are curious.
As you can see on page two, lots of components got RMA'd because people thought they had a hardware issue. I ended up purchasing a second PSU, motherboard and CPU to troubleshoot. In the end I gave the new system to my girlfriend, so not the end of the world, but very frustrating experience.
Please restest with HWINFO64.
Free Download HWiNFO Sofware | Installer & Portable for Windows, DOS
HWMONITOR is not good at giving correct information on ryzen.
Also for that mater get ryzen master an see what that says
Ryzen Master is the official AMD tool. It reports a rolling average CPU temperature. Hwinfo64 shows various temperature sensors. It isn't about which one is right it's about understanding what the values mean.
If you want to simply know how hot is the CPU as a whole then Ryzen Master temp is fine or it should be very similar to CPU Die average in HWinfo.
Check out this post from the hwinfo forums. Second comment, user Zach. The information still applies to 5000 series CPUs.
" Ryzen3000 has more than 50 temp sensors around the core Die (CCD).CPU (Tctl/Tdie) is the hotspot of the CPU and its switching (a few hundred times within a sec) between all sensors and report constantly the highest one. No other CPU do that. Only ZEN2.Die (average) is the average value of all sensors combined togetherCCD1 (Tdie) is reporting one single sensor at some edge of the core Die
In general all those 3 reports are true but reporting different things. We can say that CCD1 or Die(average) is more of the traditional CPU temp reporting. But Tctl/Tdie is important too as this is the one controling the fan of CPU cooler (hence Tctl=Tcontrol). Tctl/Tdie is up and down constantly and it is normal. "
I found the answer to that here
> The 'perf#" values denote the Core Performance Order index. I added this information into sensors as I think it might be useful for checking core utilization/clock with respect to the favored cores order.
If there are 2 numbers shown (perf# 1/2), then:
- The first number specifies the CPPC order as defined by the firmware via to Windows. This is available on AMD Zen2 CPUs with latest firmware and Windows 10 and it's the order that's used by Windows scheduler.
- The second number specifies the favored core order defined by hardware
The picture and post title question alone, don't provide enough information for anyone to give you meaningful input.
- Is it stable when benchmarking?
- Are these settings for benchmark/fun, or everyday use?
- Is it stable when stress testing?
- Is it stable with your daily workloads?
- What cpu temps are you getting? (I recommend hardware info https://www.hwinfo.com/download/)
- What voltages are you actually using? (CPUz reports VID, which is not the same as Vcore. VID is what the CPU is requesting and Vcore is what the CPU is receiving. Those can be completely different things especially when the CPU is in a loaded condition. Make sure your watch Vcore. VID is good to know for certain things, but Vcore is the important thing. View your Vcore using hardware info)
- Are you using AVX offset?
- Whats your LLC set to?
- Are you using a reduced cache ratio?
This is the question I’ve had first and foremost too regarding the topic.
I currently have Stats filling up my menu bar (along with Macs Fan Control of course and a few other items) and on my early 2015 MBP I already have to switch to Terminal or some other app low on menu bar items to see some on the right hand side that’s customizable that were too far off to the left.
I think a two-row menu bar for apps to the left together with its increased height would’ve come in handy, maybe.
System Profiler gets you a long way, something like Screenfetch or neofetch on the terminal (via homebrew) is nice for a quick overview. There’s lots of temperature monitoring apps, smcfancontrol is a nice one. Alternatively there’s apps like Stats but the macOS support is limited; https://github.com/exelban/stats Or iStat Menus which is paid, and I honestly wouldn’t trust that to stay activated if you use the drive with a lot of Macs.
http://www.palit.com/palit/thundermaster.php?lang
Oder MSI Afterburner und Fan Profil erstellen mit dem du leben kannst und das dein PC ausreichend belüftet.
I had this exact problem with my gtx 980 and found this thread:
https://forums.frontier.co.uk/showthread.php/347564-Crash-in-Geforce-experience
CMDR Luna - Post #4
> Hello CMDR.
>The most commonly used program for checking and altering GPU clock speed would be MSI Afterburner:
>https://www.msi.com/page/afterburner
>A lot of the 900 series cards are actually factory overclocked and will cause these D3D Buffer (TDR) errors in ED.
>In general, overclocking is unstable. In our case here, the planets in the game use shader calculations. The shaders stage at the start of the game involves your graphics card being put through timing tests so the game knows when it's safe to ask things of your PC. With an overclocked card, these calculations can unfortunately go wrong.
>In all of the cases I've had so far where the card has been notched down by 50Mhz, the crashes have been completely eliminated.
This is very strange.. I also have a 1080Ti and a 7700k and have constant 144fps @2560x1440, everything on ultra.
Sc2 is an old game and your hardware is super fucking powerful, you shouldn't drop a single frame with that.
I would keep an eye on the temperatures, I recommend MSI Afterburner, (you don't need a MSI card to use it.) You can monitor everything with that, temperatures of CPU GPU, load, and so on.
I guess diskspace isn't a problem? It's also helpful to give windows a fixed pagefile size.
If you have a HDD ,defrag it, also do you a virus scan.
It really shouldn't be a hardware problem, especially because you get the framedrops only in sc2.
If nothing of this helps, I would reinstall sc2.
> Is there any software I could use to track my CPU and GPU usage while I'm gaming
MSI Afterbruner can do that.
> Because of that my PC's CPU flies up to 90-100% when I'm in the character customization screen.
If this is indeed due to Denuvo, as you say, I doubt there is anything you can do about it besides getting a version without the DRM. However, doing some quick online checks seems to indicate the usual CPU usage problem should be non-existent since Injustice 2 does not use VMprotect. Whether this is true or not, I cannot say as I don't know enough about the inner workings of Denuvo.
Perhaps take a look at the background processes to see if there is anything else hogging your CPU clocks. Also verify your temperatures. Since you seem to be on a laptop, thermals might be an issue causing your CPU to throttle. Same goes for the GPU. You can check temperatures as well as usage in MSI Afterburner.
I’d ask you to expand, but I don’t want to put your bullshitting skills on the spot.
OP obviously meant something similar to istat menu
“Network Keep on top of what’s being sent and received for all network connections with history graphs, current bandwidth usage, and a bandwidth breakdown for the top apps, as well as detailed connection info, bandwidth graphs, public and private IP addresses, and an internet connectivity indicator.”
You’re imagining, it appears to me, as if OP is asking for some perpetual speedtest.net result. I don’t even want to try wrapping my head around the stupidity of that.
What are the temps reported by your cpu/gpu? It may be time for a better fan, water cooling, or maybe just check the thermal paste.
As far as temps go, I use Speedfan to keep an eye on my temperatures.
There's a lot of good recommendations here, but also some really misinformed recommendations.
You probably shouldn't be tinkering with overclocking or unparking if you have concerns about overheating or needing to kill off processes in the background. All that will do is kill hardware that much faster, which ironically loops back to investing in hardware upgrades anyways.
Manually killing off processes is a terrible idea for anyone that isn't an IT professional. Nothing says "fun" like killing off a few system processes that you shouldn't have. Use reputable utilities that provide this as a maintenance feature instead. Also on that note, performing tasks like defragmenting can increase performance (just don't do it on a solid state drive, it will reduce hardware life and the firmware already takes care of this efficiently).
SpeedFan is a great utility that allows you to control your system fans. Some operating systems are not as good at doing this as others, so you can set certain thresholds of when to increase fan power. (i.e., ramp up from 50% speed to 75% speed over 3 minutes if the CPU hits 60 Celsius) It is much cheaper to replace a fan than to deal with hardware damage.
These days, any reputable anti-virus program will not conflict with each other and really stopped being an issue around Windows XP. The biggest concern is if you have both AVs actively scanning, which puts hefty constraints on disk I/O and CPU utilization. If they're sitting passively in the background, they'll take up minimal resources. Different vendors rely on a mixture of different technologies to do this, so it may be heuristic analysis or just hashing in use files to see if they have changed since the last scan, etc.
tl;dr: Be careful when tinkering with your system. Know your technology. Advice that was valid 15 years ago may no longer be applicable. Do your research. Weigh the pros and cons.
Download and run speedfan, make sure you don't have an overheating issue, especially with your graphics card.
If that's not a problem, try updating your graphics card drivers to the latest version.
If that doesn't fix it either, try deleting all the game files and redownloading them, it's possible they're somehow corrupted.
HWiNFO64 is the best hardware monitoring software for Windows (especially for Ryzen). Run it with sensors enabled and you should be able to monitor every hardware sensor in your PC as well as be able to monitor CPU, GPU and memory frequency in real time.
BTW if you haven't already you should update your BIOS. BIOS updates on AM4 often bring microcode updates (refereed to as A.G.E.S.A) which improve performance and stability so it's important to keep your BIOS up to date.